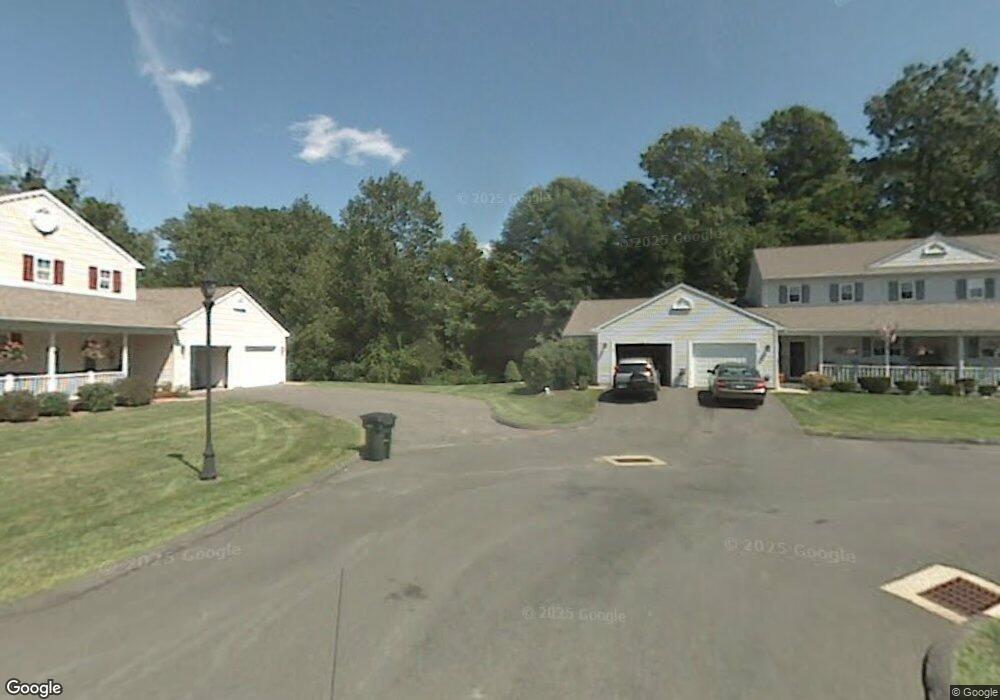
56 Dibble Hollow Ln Windsor Locks, CT 06096
Estimated Value: $290,807 - $325,000
2
Beds
4
Baths
1,077
Sq Ft
$283/Sq Ft
Est. Value
About This Home
This home is located at 56 Dibble Hollow Ln, Windsor Locks, CT 06096 and is currently estimated at $304,452, approximately $282 per square foot. 56 Dibble Hollow Ln is a home located in Hartford County with nearby schools including North Street School, South Elementary School, and Windsor Locks Middle School.
Ownership History
Date
Name
Owned For
Owner Type
Purchase Details
Closed on
Jul 2, 2018
Sold by
Carter Stephen and Stears Mary G
Bought by
Chagnon Carol A
Current Estimated Value
Home Financials for this Owner
Home Financials are based on the most recent Mortgage that was taken out on this home.
Original Mortgage
$143,500
Outstanding Balance
$124,381
Interest Rate
4.6%
Mortgage Type
Purchase Money Mortgage
Estimated Equity
$180,071
Purchase Details
Closed on
Nov 18, 2005
Sold by
Ferolano Joe and Ferolano Marie
Bought by
Stearns Mary and Carter Stephen
Purchase Details
Closed on
May 28, 1999
Sold by
Williams James H Est
Bought by
Gayette Douglas and Gayette Sherry
Home Financials for this Owner
Home Financials are based on the most recent Mortgage that was taken out on this home.
Original Mortgage
$11,667
Interest Rate
6.85%
Purchase Details
Closed on
May 24, 1991
Sold by
Dh Dev Inc
Bought by
Cahmplin Cn William
Create a Home Valuation Report for This Property
The Home Valuation Report is an in-depth analysis detailing your home's value as well as a comparison with similar homes in the area
Home Values in the Area
Average Home Value in this Area
Purchase History
| Date | Buyer | Sale Price | Title Company |
|---|---|---|---|
| Chagnon Carol A | $205,000 | -- | |
| Stearns Mary | $232,000 | -- | |
| Gayette Douglas | $122,000 | -- | |
| Cahmplin Cn William | $171,390 | -- |
Source: Public Records
Mortgage History
| Date | Status | Borrower | Loan Amount |
|---|---|---|---|
| Open | Chagnon Carol A | $143,500 | |
| Previous Owner | Cahmplin Cn William | $11,863 | |
| Previous Owner | Cahmplin Cn William | $11,667 | |
| Previous Owner | Cahmplin Cn William | $118,340 | |
| Previous Owner | Cahmplin Cn William | $114,400 |
Source: Public Records
Tax History
| Year | Tax Paid | Tax Assessment Tax Assessment Total Assessment is a certain percentage of the fair market value that is determined by local assessors to be the total taxable value of land and additions on the property. | Land | Improvement |
|---|---|---|---|---|
| 2025 | $4,400 | $183,400 | $0 | $183,400 |
| 2024 | $3,595 | $127,750 | $0 | $127,750 |
| 2023 | $3,364 | $127,750 | $0 | $127,750 |
| 2022 | $3,300 | $127,750 | $0 | $127,750 |
| 2021 | $3,300 | $127,750 | $0 | $127,750 |
| 2020 | $3,300 | $127,750 | $0 | $127,750 |
| 2019 | $3,300 | $127,750 | $0 | $127,750 |
| 2017 | $2,797 | $104,900 | $0 | $104,900 |
| 2016 | $2,797 | $104,900 | $0 | $104,900 |
| 2015 | $2,810 | $104,900 | $0 | $104,900 |
| 2014 | $3,468 | $132,200 | $0 | $132,200 |
Source: Public Records
Map
Nearby Homes
- 117 Dibble Hollow Ln
- 124 Bel-Aire Cir
- 24 Bel-Aire Cir
- 94 Raymond Rd
- 59 Elm St
- 241 S Water St Unit 11
- 241 S Water St Unit 14
- 140 S Water St
- 10 Helena Ln
- 13 Riverview Dr Unit F
- 32 Walnut Cir
- 202 Reed Ave
- 216 Adams Hill Way Unit 216
- 64 Main St
- 4 Woodland Hollow St
- 0 N Water St Unit 24138494
- 0 N Water St Unit 24128295
- 0 N Water St Unit 24128294
- 0 N Water St Unit 24128288
- 0 N Water St
- 56 Dibble Hollow Ln Unit 56
- 54 Dibble Hollow Ln
- 52 Dibble Hollow Ln
- 52 Dibble Hollow Ln Unit 52
- 50 Dibble Hollow Ln
- 50 Dibble Hollow Ln Unit 50
- 60 Dibble Hollow Ln
- 58 Dibble Hollow Ln
- 58 Dibble Hollow Ln Unit 58
- 62 Dibble Hollow Ln
- 62 Dibble Hollow Ln Unit 62
- 46 Dibble Hollow Ln
- 48 Dibble Hollow Ln
- 44 Dibble Hollow Ln
- 86 Dibble Hollow Ln
- 64 Dibble Hollow Ln
- 64 Dibble Hollow Ln Unit 64
- 82 Dibble Hollow Ln
- 82 Dibble Hollow Ln Unit 82
- 80 Dibble Hollow Ln
Your Personal Tour Guide
Ask me questions while you tour the home.