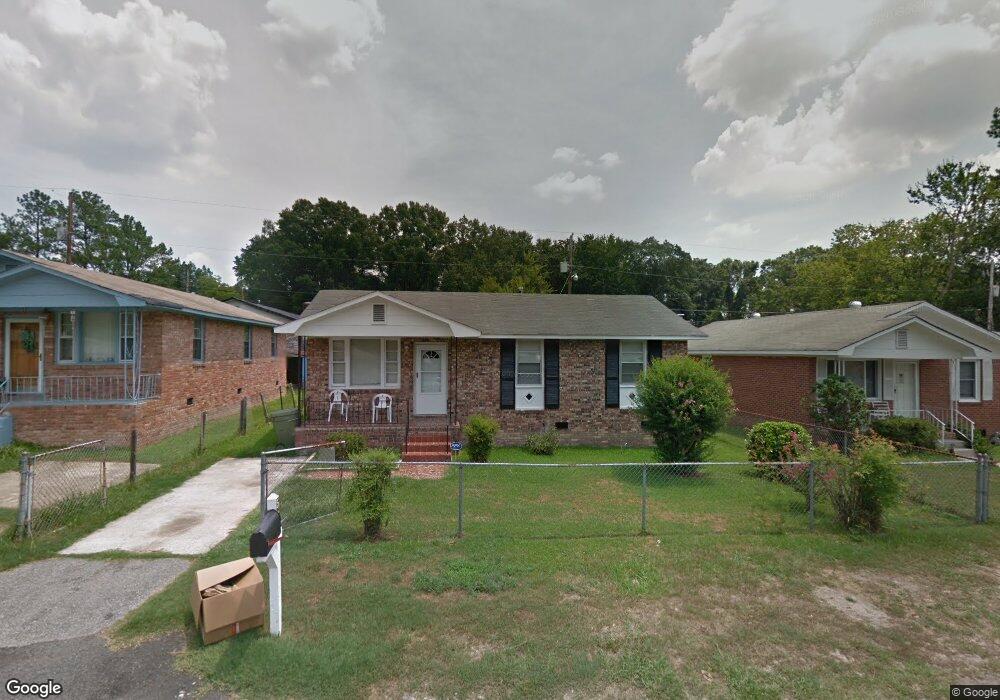
56 Dumont St Columbia, SC 29201
Arthurtown NeighborhoodEstimated Value: $73,000 - $120,000
3
Beds
1
Bath
975
Sq Ft
$101/Sq Ft
Est. Value
About This Home
This home is located at 56 Dumont St, Columbia, SC 29201 and is currently estimated at $98,330, approximately $100 per square foot. 56 Dumont St is a home located in Richland County with nearby schools including South Kilbourne Elementary School, Hand Middle School, and Dreher High School.
Ownership History
Date
Name
Owned For
Owner Type
Purchase Details
Closed on
Feb 27, 2007
Sold by
J Miller Properties Llc
Bought by
Hollins Jerry L and Hollins Tania M
Current Estimated Value
Home Financials for this Owner
Home Financials are based on the most recent Mortgage that was taken out on this home.
Original Mortgage
$40,050
Interest Rate
5.65%
Mortgage Type
Purchase Money Mortgage
Purchase Details
Closed on
Jul 1, 2005
Sold by
Opportunity Knocks Llc
Bought by
J Miller Properties Llc
Purchase Details
Closed on
Apr 29, 2005
Sold by
Scott Geneva
Bought by
Opportunity Knocks Llc
Home Financials for this Owner
Home Financials are based on the most recent Mortgage that was taken out on this home.
Original Mortgage
$19,805
Interest Rate
5.88%
Mortgage Type
Purchase Money Mortgage
Create a Home Valuation Report for This Property
The Home Valuation Report is an in-depth analysis detailing your home's value as well as a comparison with similar homes in the area
Home Values in the Area
Average Home Value in this Area
Purchase History
| Date | Buyer | Sale Price | Title Company |
|---|---|---|---|
| Hollins Jerry L | $44,500 | -- | |
| J Miller Properties Llc | $26,000 | -- | |
| Opportunity Knocks Llc | $15,700 | -- |
Source: Public Records
Mortgage History
| Date | Status | Borrower | Loan Amount |
|---|---|---|---|
| Previous Owner | Hollins Jerry L | $40,050 | |
| Previous Owner | Opportunity Knocks Llc | $19,805 |
Source: Public Records
Tax History Compared to Growth
Tax History
| Year | Tax Paid | Tax Assessment Tax Assessment Total Assessment is a certain percentage of the fair market value that is determined by local assessors to be the total taxable value of land and additions on the property. | Land | Improvement |
|---|---|---|---|---|
| 2024 | $1,238 | $32,300 | $0 | $0 |
| 2023 | $1,205 | $1,124 | $0 | $0 |
| 2022 | $1,104 | $28,100 | $4,500 | $23,600 |
| 2021 | $1,083 | $1,690 | $0 | $0 |
| 2020 | $1,087 | $1,690 | $0 | $0 |
| 2019 | $1,053 | $1,690 | $0 | $0 |
| 2018 | $997 | $1,630 | $0 | $0 |
| 2017 | $974 | $1,630 | $0 | $0 |
| 2016 | $960 | $1,630 | $0 | $0 |
| 2015 | $949 | $1,630 | $0 | $0 |
| 2014 | $934 | $27,100 | $0 | $0 |
| 2013 | -- | $1,630 | $0 | $0 |
Source: Public Records
Map
Nearby Homes
- 1218 Walcott St
- 1213 Walcott St
- 1929 Bluff Rd Unit 148
- 1929 Bluff Rd Unit 193
- 1929 Bluff Rd Unit UNT96
- 1929 Bluff Rd Unit UNT26
- 1929 Bluff Rd Unit 162
- 1929 Bluff Rd Unit 67
- 1929 Bluff Rd Unit UNT44
- 1929 Bluff Rd Unit UNT25
- 1522 Hibiscus St
- 1506 S Kilbourne Rd
- 1504 Dahlia Rd
- 1634 S Beltline Blvd
- 1637 Tall Pines Cir
- 1450 Ilex St
- 1769 Tall Pines Cir
- 1801 Tall Pines Cir
- 1439 Dahlia Rd
- 1404 S Ott Rd