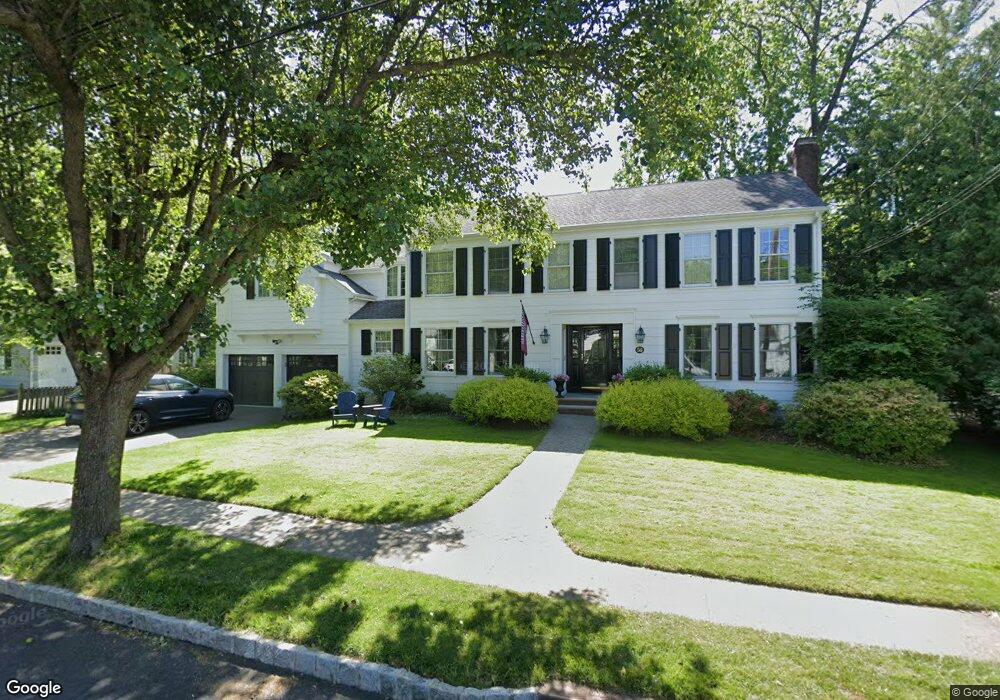
56 Dunbar St Chatham, NJ 07928
Estimated Value: $1,592,000 - $1,858,228
--
Bed
--
Bath
2,678
Sq Ft
$649/Sq Ft
Est. Value
About This Home
This home is located at 56 Dunbar St, Chatham, NJ 07928 and is currently estimated at $1,736,807, approximately $648 per square foot. 56 Dunbar St is a home located in Morris County with nearby schools including Chatham High School, St. Patrick School, and ECLC of New Jersey.
Ownership History
Date
Name
Owned For
Owner Type
Purchase Details
Closed on
Mar 17, 2006
Sold by
Cendant Mobility Financial Cor
Bought by
Windels Francis and Windels Maurgen
Current Estimated Value
Home Financials for this Owner
Home Financials are based on the most recent Mortgage that was taken out on this home.
Original Mortgage
$840,000
Outstanding Balance
$478,930
Interest Rate
6.32%
Mortgage Type
New Conventional
Estimated Equity
$1,257,877
Purchase Details
Closed on
Mar 26, 2002
Sold by
Outwater Robert
Bought by
Buck Ambrose and Buck Michele
Home Financials for this Owner
Home Financials are based on the most recent Mortgage that was taken out on this home.
Original Mortgage
$300,000
Interest Rate
6.85%
Create a Home Valuation Report for This Property
The Home Valuation Report is an in-depth analysis detailing your home's value as well as a comparison with similar homes in the area
Home Values in the Area
Average Home Value in this Area
Purchase History
| Date | Buyer | Sale Price | Title Company |
|---|---|---|---|
| Windels Francis | $1,050,000 | -- | |
| Cendant Mobility Financial Cor | $1,100,000 | -- | |
| Buck Ambrose | $787,500 | -- |
Source: Public Records
Mortgage History
| Date | Status | Borrower | Loan Amount |
|---|---|---|---|
| Open | Cendant Mobility Financial Cor | $840,000 | |
| Closed | Cendant Mobility Financial Cor | $840,000 | |
| Previous Owner | Buck Ambrose | $300,000 |
Source: Public Records
Tax History Compared to Growth
Tax History
| Year | Tax Paid | Tax Assessment Tax Assessment Total Assessment is a certain percentage of the fair market value that is determined by local assessors to be the total taxable value of land and additions on the property. | Land | Improvement |
|---|---|---|---|---|
| 2025 | $22,020 | $1,360,100 | $702,900 | $657,200 |
| 2024 | $21,136 | $1,360,100 | $702,900 | $657,200 |
| 2023 | $21,136 | $1,360,100 | $702,900 | $657,200 |
| 2022 | $20,588 | $963,400 | $497,400 | $466,000 |
| 2021 | $20,588 | $963,400 | $497,400 | $466,000 |
| 2020 | $20,414 | $963,400 | $497,400 | $466,000 |
| 2019 | $20,270 | $963,400 | $497,400 | $466,000 |
| 2018 | $19,702 | $963,400 | $497,400 | $466,000 |
| 2017 | $19,133 | $963,400 | $497,400 | $466,000 |
| 2016 | $18,632 | $963,400 | $497,400 | $466,000 |
| 2015 | $18,411 | $963,400 | $497,400 | $466,000 |
| 2014 | $18,276 | $963,400 | $497,400 | $466,000 |
Source: Public Records
Map
Nearby Homes
- 1 John St
- 17 Coleman Ave W
- 15 Duchamp Place
- 10 Garden Place
- 151 Center Ave
- 29 N Hillside Ave
- 22 Weston Ave
- 49 N Summit Ave Unit B
- 8 Mercer Ave
- 24 N Summit Ave
- 30 Hillside Ave
- 111 N Summit Ave
- 5 Penn Terrace
- 84 Fairmount Ave
- 318 Main St Unit 14
- 318 Main St Unit 9
- 149 N Hillside Ave
- 20 Orchard Rd
- 43 Sherbrooke Dr
- 169 Watchung Ave