M
Seller's Agent in 2016
MaryEllen Salerno
CENTURY 21 Select Group - Lake Harmony
Estimated Value: $100,000 - $114,151
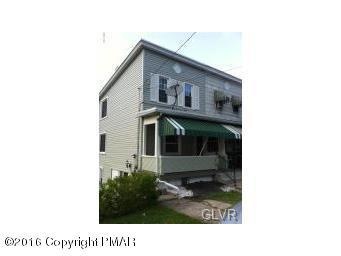
Nice end of row in good condition. 3 bedroom 1.5 bath(commode only. Beautiful woodwork, nice deck, newer siding, large lot. Great Price!!
Last Agent to Sell the Property
MaryEllen Salerno
CENTURY 21 Select Group - Lake Harmony License #RS225805L Listed on: 03/29/2016

Last Buyer's Agent
(Lehigh) GLVR Member
NON MEMBER
| Date | Buyer | Sale Price | Title Company |
|---|---|---|---|
| Smith Jesse L | $55,000 | Home Settlment Services | |
| Reabold Ii Richard | $19,900 | None Available | |
| Us Bank National Association | $1,069 | None Available | |
| U S Bank National Association | $1,069 | None Available | |
| Mistretta Anthony | $25,000 | -- |
| Date | Status | Borrower | Loan Amount |
|---|---|---|---|
| Open | Smith Jesse L | $55,555 |
| Date | Event | Price | List to Sale | Price per Sq Ft |
|---|---|---|---|---|
| 04/25/2016 04/25/16 | Sold | $19,900 | 0.0% | $18 / Sq Ft |
| 04/01/2016 04/01/16 | Pending | -- | -- | -- |
| 03/29/2016 03/29/16 | For Sale | $19,900 | -- | $18 / Sq Ft |
| Year | Tax Paid | Tax Assessment Tax Assessment Total Assessment is a certain percentage of the fair market value that is determined by local assessors to be the total taxable value of land and additions on the property. | Land | Improvement |
|---|---|---|---|---|
| 2025 | $1,756 | $18,581 | $4,100 | $14,481 |
| 2024 | $1,827 | $18,581 | $4,100 | $14,481 |
| 2023 | $1,790 | $18,581 | $4,100 | $14,481 |
| 2022 | $1,802 | $18,581 | $4,100 | $14,481 |
| 2021 | $1,802 | $18,581 | $4,100 | $14,481 |
| 2020 | $1,005 | $10,529 | $4,100 | $6,429 |
| 2019 | $948 | $10,529 | $4,100 | $6,429 |
| 2018 | $937 | $10,529 | $4,100 | $6,429 |
| 2017 | $937 | $10,529 | $4,100 | $6,429 |
| 2016 | -- | $12,600 | $4,100 | $8,500 |
| 2015 | -- | $12,600 | $4,100 | $8,500 |
| 2014 | -- | $12,600 | $4,100 | $8,500 |
M
Seller's Agent in 2016
MaryEllen Salerno
CENTURY 21 Select Group - Lake Harmony
(
Buyer's Agent in 2016
(Lehigh) GLVR Member
NON MEMBER
Source: Pocono Mountains Association of REALTORS®
MLS Number: PM-33602
APN: 105B1-41-H27
Disclaimer: Certain information contained herein is derived from information provided by parties other than Homes.com. All information provided is deemed reliable, but is not guaranteed to be accurate and should be independently verified.
![]() The data relating to real estate for sale on this web site includes listings held by MLS-IDX Participants of the Internet Data Exchange program of the Multiple Listing Service of the Pocono Mountains Association of Realtors®. Listings marked with the Internet Data Exchange logo are not necessarilty the listings of the owner of this web site. All listing data is the copyrighted property of the aforesaid Associations and its MLS-IDX Participants with all rights reserved. The information contained herein is believed to be accurate, but no warranty as such is expressed or implied.
The data relating to real estate for sale on this web site includes listings held by MLS-IDX Participants of the Internet Data Exchange program of the Multiple Listing Service of the Pocono Mountains Association of Realtors®. Listings marked with the Internet Data Exchange logo are not necessarilty the listings of the owner of this web site. All listing data is the copyrighted property of the aforesaid Associations and its MLS-IDX Participants with all rights reserved. The information contained herein is believed to be accurate, but no warranty as such is expressed or implied.