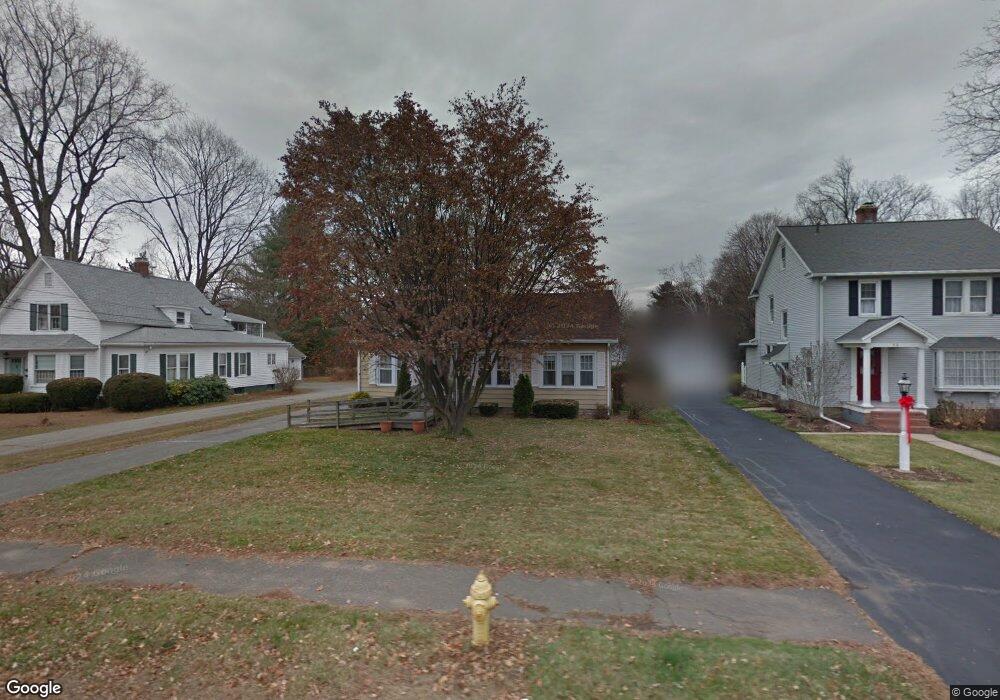
56 Elm St Agawam, MA 01001
Estimated Value: $365,000 - $418,000
4
Beds
2
Baths
1,744
Sq Ft
$228/Sq Ft
Est. Value
About This Home
This home is located at 56 Elm St, Agawam, MA 01001 and is currently estimated at $397,415, approximately $227 per square foot. 56 Elm St is a home located in Hampden County with nearby schools including Agawam Junior High School, Agawam High School, and St Thomas The Apostle School.
Ownership History
Date
Name
Owned For
Owner Type
Purchase Details
Closed on
Apr 7, 2010
Sold by
Williams Raymond C
Bought by
Williams Raymond C and Williams Nancy J
Current Estimated Value
Home Financials for this Owner
Home Financials are based on the most recent Mortgage that was taken out on this home.
Original Mortgage
$164,000
Outstanding Balance
$109,877
Interest Rate
5.12%
Mortgage Type
Purchase Money Mortgage
Estimated Equity
$287,538
Purchase Details
Closed on
Apr 6, 2009
Sold by
Williams Raymond C
Bought by
Williams Raymond C
Purchase Details
Closed on
Jun 20, 2007
Sold by
Williams Barbara A and Williams Raymond C
Bought by
Williams Raymond C
Purchase Details
Closed on
Apr 27, 1995
Sold by
Poulin Michael F and Poulin Cindy L
Bought by
Williams Raymond C and Williams Barbara A
Create a Home Valuation Report for This Property
The Home Valuation Report is an in-depth analysis detailing your home's value as well as a comparison with similar homes in the area
Home Values in the Area
Average Home Value in this Area
Purchase History
| Date | Buyer | Sale Price | Title Company |
|---|---|---|---|
| Williams Raymond C | -- | -- | |
| Williams Raymond C | -- | -- | |
| Williams Raymond C | -- | -- | |
| Williams Raymond C | $115,500 | -- |
Source: Public Records
Mortgage History
| Date | Status | Borrower | Loan Amount |
|---|---|---|---|
| Open | Williams Raymond C | $164,000 | |
| Previous Owner | Williams Raymond C | $165,750 | |
| Previous Owner | Williams Raymond C | $114,488 | |
| Previous Owner | Williams Raymond C | $113,855 |
Source: Public Records
Tax History Compared to Growth
Tax History
| Year | Tax Paid | Tax Assessment Tax Assessment Total Assessment is a certain percentage of the fair market value that is determined by local assessors to be the total taxable value of land and additions on the property. | Land | Improvement |
|---|---|---|---|---|
| 2025 | $5,042 | $344,400 | $111,600 | $232,800 |
| 2024 | $4,826 | $331,900 | $111,600 | $220,300 |
| 2023 | $4,691 | $297,300 | $100,600 | $196,700 |
| 2022 | $4,480 | $278,100 | $100,600 | $177,500 |
| 2021 | $4,145 | $246,700 | $87,000 | $159,700 |
| 2020 | $4,027 | $239,300 | $85,500 | $153,800 |
| 2019 | $3,906 | $234,600 | $83,700 | $150,900 |
| 2018 | $3,658 | $220,200 | $79,300 | $140,900 |
| 2017 | $3,464 | $212,400 | $79,300 | $133,100 |
| 2016 | $3,362 | $207,800 | $79,300 | $128,500 |
| 2015 | $3,187 | $202,500 | $79,300 | $123,200 |
Source: Public Records
Map
Nearby Homes
- 869-871 Main St
- 4H Mapleviewlane Unit 4H
- 0 Silver St
- 64 Woodside Dr
- 49 Hearthstone Dr
- 4 H Castle Hills Rd Unit H
- 52 Peros Dr
- 1 Castle Hill Rd Unit D
- 15 Bailey St
- 15 B Castle Hills Rd Unit B
- 6 Mansion Woods Dr Unit A
- 25 Castle Hill Rd Unit E
- 135 Corey Colonial
- 20 Castle Hill Rd Unit D
- 420 Main St Unit 82
- 420 Main St Unit 71
- 83 Fairview St
- 95 Meadowbrook Rd
- 28 Meadow Ave
- 73 Silver Lake Dr