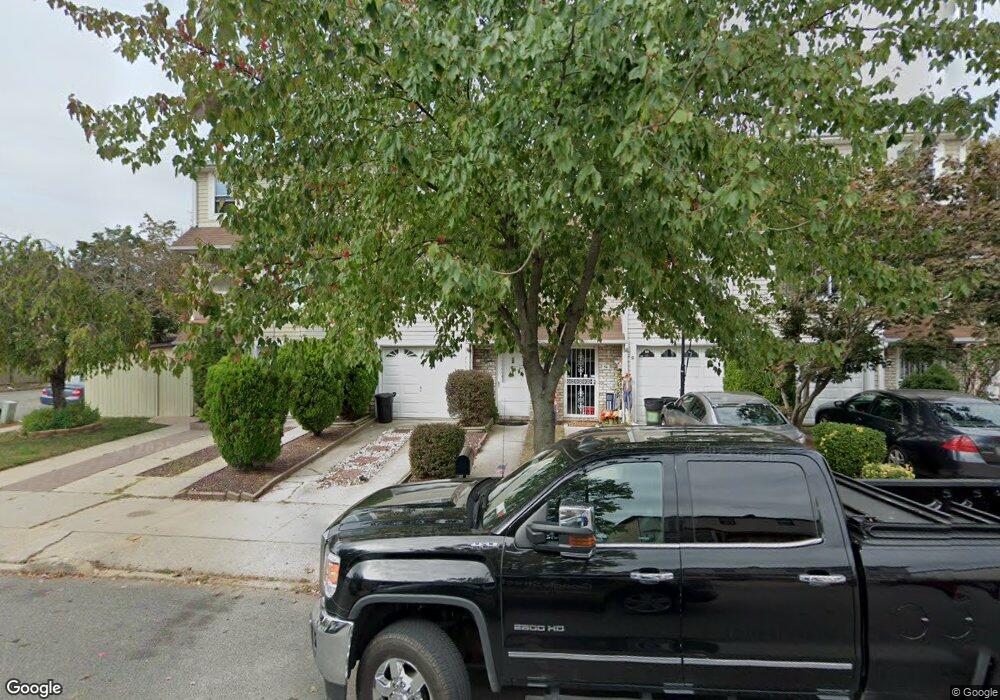
56 Elson St Staten Island, NY 10314
Bulls Head NeighborhoodEstimated Value: $664,504 - $731,000
3
Beds
3
Baths
1,989
Sq Ft
$354/Sq Ft
Est. Value
About This Home
This home is located at 56 Elson St, Staten Island, NY 10314 and is currently estimated at $703,876, approximately $353 per square foot. 56 Elson St is a home located in Richmond County with nearby schools including P.S. 060 Alice Austen School, Is 72 Rocco Laurie, and Port Richmond High School.
Ownership History
Date
Name
Owned For
Owner Type
Purchase Details
Closed on
Apr 8, 2005
Sold by
Obrien Jeffrey and Obrien April
Bought by
Cheuk Tat Lung
Current Estimated Value
Home Financials for this Owner
Home Financials are based on the most recent Mortgage that was taken out on this home.
Original Mortgage
$270,000
Interest Rate
5.95%
Mortgage Type
Purchase Money Mortgage
Purchase Details
Closed on
Jan 8, 2002
Sold by
Palansky Steven and Palansky Cheryl
Bought by
Obrien Jeffey and Obrien April
Home Financials for this Owner
Home Financials are based on the most recent Mortgage that was taken out on this home.
Original Mortgage
$228,000
Interest Rate
7.01%
Mortgage Type
Purchase Money Mortgage
Create a Home Valuation Report for This Property
The Home Valuation Report is an in-depth analysis detailing your home's value as well as a comparison with similar homes in the area
Home Values in the Area
Average Home Value in this Area
Purchase History
| Date | Buyer | Sale Price | Title Company |
|---|---|---|---|
| Cheuk Tat Lung | $370,000 | Commonwealth Title | |
| Obrien Jeffey | $243,000 | -- |
Source: Public Records
Mortgage History
| Date | Status | Borrower | Loan Amount |
|---|---|---|---|
| Open | Cheuk Tat Lung | $5,017 | |
| Open | Cheuk Tat Lung | $55,198 | |
| Previous Owner | Cheuk Tat Lung | $270,000 | |
| Previous Owner | Obrien Jeffery | $42,900 | |
| Previous Owner | Obrien Jeffrey | $27,924 | |
| Previous Owner | Obrien Jeffey | $228,000 | |
| Previous Owner | Palansky Steven | $117,200 |
Source: Public Records
Tax History Compared to Growth
Tax History
| Year | Tax Paid | Tax Assessment Tax Assessment Total Assessment is a certain percentage of the fair market value that is determined by local assessors to be the total taxable value of land and additions on the property. | Land | Improvement |
|---|---|---|---|---|
| 2025 | $5,189 | $39,660 | $3,770 | $35,890 |
| 2024 | $5,189 | $38,880 | $3,628 | $35,252 |
| 2023 | $5,247 | $25,834 | $3,944 | $21,890 |
| 2022 | $5,118 | $35,760 | $5,460 | $30,300 |
| 2021 | $5,090 | $32,040 | $5,460 | $26,580 |
| 2020 | $4,830 | $31,260 | $5,460 | $25,800 |
| 2019 | $4,503 | $30,600 | $5,460 | $25,140 |
| 2018 | $4,388 | $21,528 | $4,535 | $16,993 |
| 2017 | $4,355 | $21,365 | $4,934 | $16,431 |
| 2016 | $4,029 | $20,156 | $4,827 | $15,329 |
| 2015 | $3,443 | $19,016 | $4,201 | $14,815 |
| 2014 | $3,443 | $17,940 | $4,560 | $13,380 |
Source: Public Records
Map
Nearby Homes
- 23 Caswell Ln
- 12 Kingsbridge Ave
- 33 Brad Ln
- 148 Roman Ave
- 240 Fahy Ave
- 164 Kirshon Ave
- 147 Kirshon Ave
- 161 Lander Ave
- 31 Fieldstone Rd
- 157 Lander Ave
- 963 Goethals Rd N Unit 137
- 8 Nadal Place
- 85 Regal Walk Unit 100
- 268 Ada Dr
- 24 Nadal Place
- 15 Oliver Place
- 50 Regal Walk Unit 23
- 277 South Ave
- 333 Hillman Ave
- 81 Selvin Loop Unit A