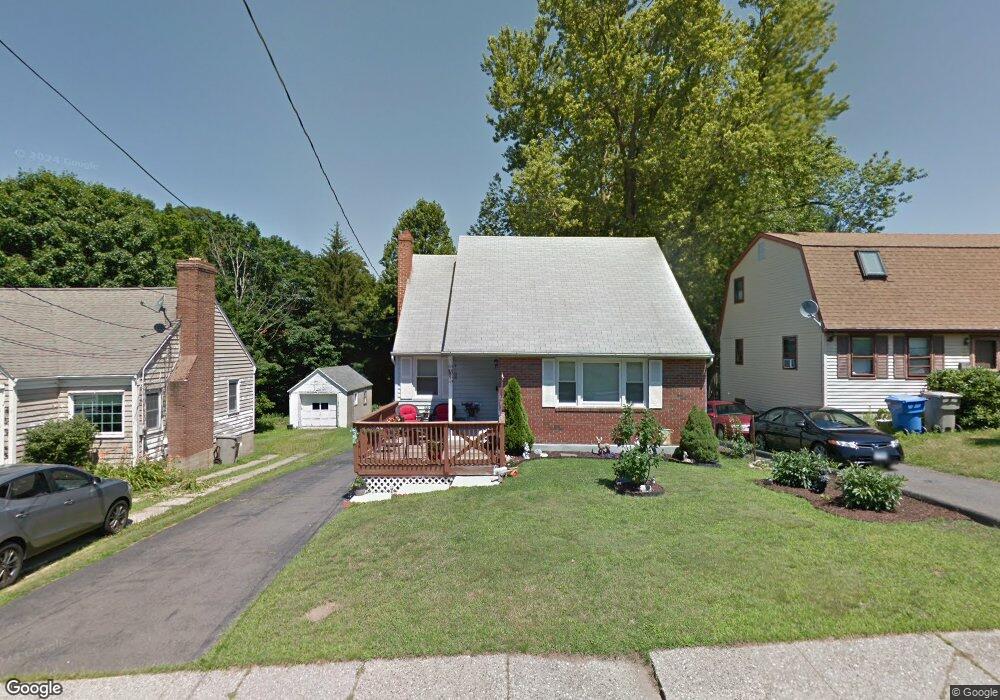
56 Field St Bristol, CT 06010
South Bristol NeighborhoodEstimated Value: $276,000 - $306,789
3
Beds
3
Baths
1,838
Sq Ft
$158/Sq Ft
Est. Value
About This Home
This home is located at 56 Field St, Bristol, CT 06010 and is currently estimated at $291,197, approximately $158 per square foot. 56 Field St is a home located in Hartford County with nearby schools including West Bristol Sch, Bristol Central High School, and Immanuel Lutheran School.
Ownership History
Date
Name
Owned For
Owner Type
Purchase Details
Closed on
Oct 7, 2013
Sold by
Department Of Housing & Urban Dev
Bought by
Gregory Stephen
Current Estimated Value
Home Financials for this Owner
Home Financials are based on the most recent Mortgage that was taken out on this home.
Original Mortgage
$98,188
Outstanding Balance
$73,058
Interest Rate
4.25%
Mortgage Type
FHA
Estimated Equity
$218,139
Purchase Details
Closed on
Jun 10, 2013
Sold by
Chfa
Bought by
Department Of Housing & Urban Dev
Purchase Details
Closed on
Oct 31, 2012
Sold by
Mason Randall L and Mason Patricia A
Bought by
Chfa
Purchase Details
Closed on
Aug 31, 2004
Sold by
Thammavongsa Lam Phong and Thammavongsa Victoria
Bought by
Mason Randall L and Mason Patricia A
Purchase Details
Closed on
Jun 17, 1998
Sold by
Sanyo Antonio and Sanyo Fiorina
Bought by
Thammavongsa Lam Phong and Thammavongsa Victoria
Create a Home Valuation Report for This Property
The Home Valuation Report is an in-depth analysis detailing your home's value as well as a comparison with similar homes in the area
Home Values in the Area
Average Home Value in this Area
Purchase History
| Date | Buyer | Sale Price | Title Company |
|---|---|---|---|
| Gregory Stephen | -- | -- | |
| Department Of Housing & Urban Dev | -- | -- | |
| Chfa | -- | -- | |
| Mason Randall L | $169,000 | -- | |
| Thammavongsa Lam Phong | $119,000 | -- |
Source: Public Records
Mortgage History
| Date | Status | Borrower | Loan Amount |
|---|---|---|---|
| Open | Thammavongsa Lam Phong | $15,000 | |
| Open | Thammavongsa Lam Phong | $98,188 | |
| Previous Owner | Thammavongsa Lam Phong | $30,000 |
Source: Public Records
Tax History Compared to Growth
Tax History
| Year | Tax Paid | Tax Assessment Tax Assessment Total Assessment is a certain percentage of the fair market value that is determined by local assessors to be the total taxable value of land and additions on the property. | Land | Improvement |
|---|---|---|---|---|
| 2025 | $5,023 | $148,820 | $33,460 | $115,360 |
| 2024 | $4,740 | $148,820 | $33,460 | $115,360 |
| 2023 | $4,517 | $148,820 | $33,460 | $115,360 |
| 2022 | $4,102 | $106,960 | $25,340 | $81,620 |
| 2021 | $4,102 | $106,960 | $25,340 | $81,620 |
| 2020 | $4,102 | $106,960 | $25,340 | $81,620 |
| 2019 | $4,070 | $106,960 | $25,340 | $81,620 |
| 2018 | $3,945 | $106,960 | $25,340 | $81,620 |
| 2017 | $3,917 | $108,710 | $36,190 | $72,520 |
| 2016 | $3,917 | $108,710 | $36,190 | $72,520 |
| 2015 | $3,762 | $108,710 | $36,190 | $72,520 |
| 2014 | $3,762 | $108,710 | $36,190 | $72,520 |
Source: Public Records
Map
Nearby Homes