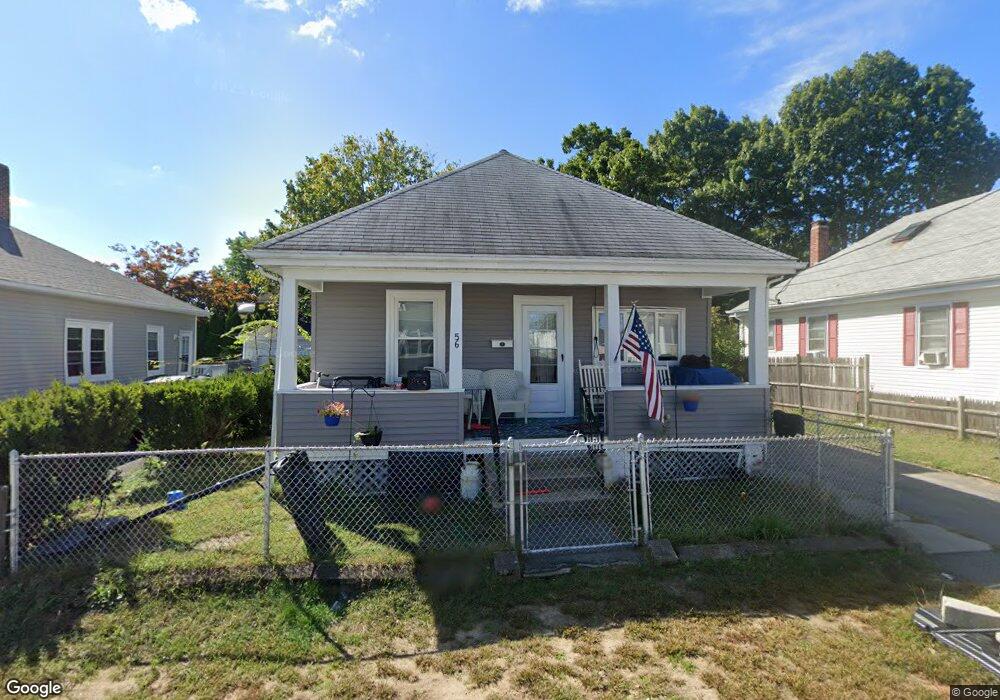
56 Finch Ave Pawtucket, RI 02860
Fairlawn NeighborhoodEstimated Value: $380,134 - $398,000
3
Beds
1
Bath
1,382
Sq Ft
$281/Sq Ft
Est. Value
About This Home
This home is located at 56 Finch Ave, Pawtucket, RI 02860 and is currently estimated at $388,534, approximately $281 per square foot. 56 Finch Ave is a home located in Providence County with nearby schools including Blackstone Valley Prep Upper Elementary School, Bishop Keough Regional High School, and Ocean Tides School.
Ownership History
Date
Name
Owned For
Owner Type
Purchase Details
Closed on
Aug 31, 1999
Sold by
Residential Funding
Bought by
Slater Investment Llc
Current Estimated Value
Home Financials for this Owner
Home Financials are based on the most recent Mortgage that was taken out on this home.
Original Mortgage
$60,000
Outstanding Balance
$16,767
Interest Rate
7.53%
Estimated Equity
$371,767
Create a Home Valuation Report for This Property
The Home Valuation Report is an in-depth analysis detailing your home's value as well as a comparison with similar homes in the area
Home Values in the Area
Average Home Value in this Area
Purchase History
| Date | Buyer | Sale Price | Title Company |
|---|---|---|---|
| Slater Investment Llc | $58,500 | -- |
Source: Public Records
Mortgage History
| Date | Status | Borrower | Loan Amount |
|---|---|---|---|
| Open | Slater Investment Llc | $60,000 |
Source: Public Records
Tax History Compared to Growth
Tax History
| Year | Tax Paid | Tax Assessment Tax Assessment Total Assessment is a certain percentage of the fair market value that is determined by local assessors to be the total taxable value of land and additions on the property. | Land | Improvement |
|---|---|---|---|---|
| 2025 | $4,019 | $305,600 | $123,600 | $182,000 |
| 2024 | $3,771 | $305,600 | $123,600 | $182,000 |
| 2023 | $3,850 | $227,300 | $67,400 | $159,900 |
| 2022 | $3,769 | $227,300 | $67,400 | $159,900 |
| 2021 | $3,769 | $227,300 | $67,400 | $159,900 |
| 2020 | $3,230 | $154,600 | $62,100 | $92,500 |
| 2019 | $3,230 | $154,600 | $62,100 | $92,500 |
| 2018 | $3,112 | $154,600 | $62,100 | $92,500 |
| 2017 | $3,038 | $133,700 | $55,400 | $78,300 |
| 2016 | $2,927 | $133,700 | $55,400 | $78,300 |
| 2015 | $2,927 | $133,700 | $55,400 | $78,300 |
| 2014 | $2,843 | $123,300 | $55,400 | $67,900 |
Source: Public Records
Map
Nearby Homes
- 132 Hobson Ave
- 149 Oakdale Ave
- 424 Smithfield Ave Unit 1
- 422 Smithfield Ave Unit 1
- 123 Francis Ave
- 27 Stedman Ave
- 21 Urban Ave
- 12 Atwood Ave
- 12 Legion Dr
- 199 Morris Ave
- 168 W Forest Ave
- 56 Legion Dr
- 136 Samuel Ave
- 82 Hillcrest Ave
- 48 Cleveland St
- 0 Martha St
- 221 Columbia Ave
- 2 Cobble Hill Rd
- 16 Rufus St
- 1111 Charles St