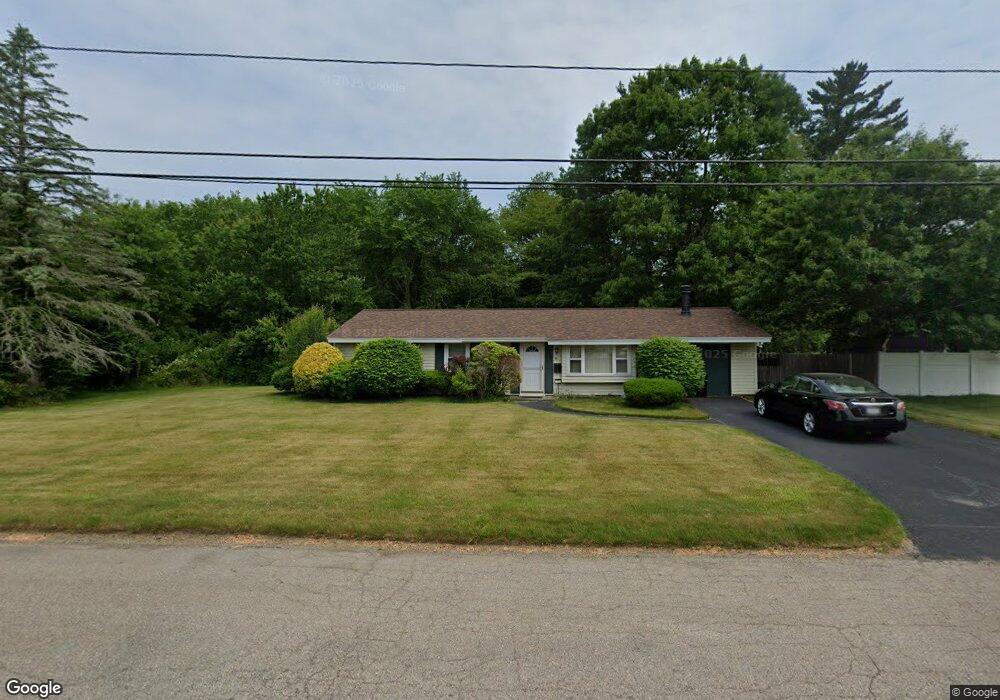
56 Foothill Rd Brockton, MA 02302
Estimated Value: $446,124 - $506,000
3
Beds
1
Bath
1,232
Sq Ft
$390/Sq Ft
Est. Value
About This Home
This home is located at 56 Foothill Rd, Brockton, MA 02302 and is currently estimated at $480,781, approximately $390 per square foot. 56 Foothill Rd is a home located in Plymouth County with nearby schools including Gilmore Elementary School, Davis K-8 School, and John F. Kennedy Elementary School.
Ownership History
Date
Name
Owned For
Owner Type
Purchase Details
Closed on
Sep 28, 1988
Sold by
Muldonia Patricia A
Bought by
Sullivan Wm P
Current Estimated Value
Home Financials for this Owner
Home Financials are based on the most recent Mortgage that was taken out on this home.
Original Mortgage
$107,000
Interest Rate
10.66%
Mortgage Type
Purchase Money Mortgage
Create a Home Valuation Report for This Property
The Home Valuation Report is an in-depth analysis detailing your home's value as well as a comparison with similar homes in the area
Purchase History
| Date | Buyer | Sale Price | Title Company |
|---|---|---|---|
| Sullivan Wm P | $124,000 | -- |
Source: Public Records
Mortgage History
| Date | Status | Borrower | Loan Amount |
|---|---|---|---|
| Open | Sullivan Wm P | $50,000 | |
| Open | Sullivan Wm P | $84,000 | |
| Closed | Sullivan Wm P | $107,000 |
Source: Public Records
Tax History
| Year | Tax Paid | Tax Assessment Tax Assessment Total Assessment is a certain percentage of the fair market value that is determined by local assessors to be the total taxable value of land and additions on the property. | Land | Improvement |
|---|---|---|---|---|
| 2025 | $4,811 | $397,300 | $160,600 | $236,700 |
| 2024 | $4,599 | $382,600 | $160,600 | $222,000 |
| 2023 | $4,433 | $341,500 | $110,900 | $230,600 |
| 2022 | $4,099 | $293,400 | $100,800 | $192,600 |
| 2021 | $4,089 | $282,000 | $93,700 | $188,300 |
| 2020 | $4,000 | $264,000 | $82,200 | $181,800 |
| 2019 | $3,692 | $237,600 | $78,500 | $159,100 |
| 2018 | $3,472 | $216,200 | $78,500 | $137,700 |
| 2017 | $2,935 | $182,300 | $78,500 | $103,800 |
| 2016 | $3,154 | $181,700 | $74,900 | $106,800 |
| 2015 | $2,806 | $154,600 | $74,900 | $79,700 |
| 2014 | $2,919 | $161,000 | $74,900 | $86,100 |
Source: Public Records
Map
Nearby Homes
- 15 Wachusetts Rd
- 12 Paulin Ave
- 23 Dondi Rd
- 118 Deanna Rd
- 549 Summer St
- 383 Summer St
- 111 Riverview St
- 100 Concord St
- 578 Plain St
- 41 Riverview St
- 4 Virginia Ave
- 107 N Leyden St
- 231 Winter St
- 223 Clinton St Unit 16
- 1 Winter St
- 23 E Chestnut St
- 24 E Chestnut St
- 1 Thomas Cir
- 103 Clinton St
- 15 Market St
Your Personal Tour Guide
Ask me questions while you tour the home.