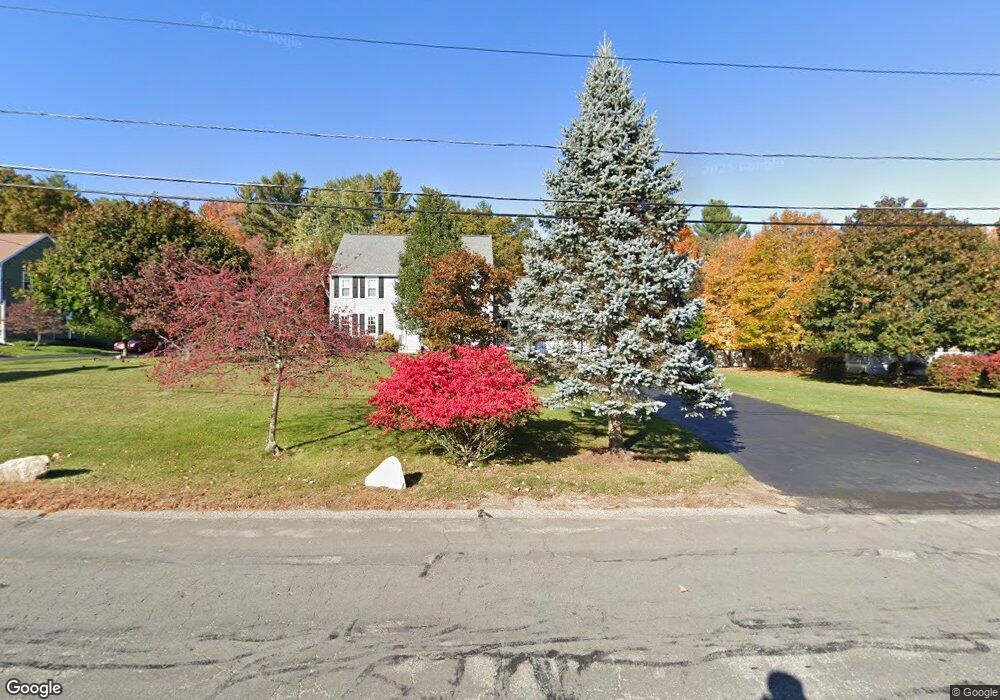
56 Fox Run Rd Bellingham, MA 02019
Estimated Value: $680,212 - $773,000
4
Beds
3
Baths
2,272
Sq Ft
$316/Sq Ft
Est. Value
About This Home
This home is located at 56 Fox Run Rd, Bellingham, MA 02019 and is currently estimated at $718,053, approximately $316 per square foot. 56 Fox Run Rd is a home located in Norfolk County with nearby schools including Joseph F. DiPietro Elementary, Bellingham High School, and Rise Prep Mayoral Academy Middle School.
Ownership History
Date
Name
Owned For
Owner Type
Purchase Details
Closed on
May 18, 2024
Sold by
Childs Christopher N and Childs Julie A
Bought by
Childs Lt and Childs
Current Estimated Value
Purchase Details
Closed on
Oct 29, 2008
Sold by
Primacy Closing Corp
Bought by
Childs Christopher and Childs Jullie
Home Financials for this Owner
Home Financials are based on the most recent Mortgage that was taken out on this home.
Original Mortgage
$330,000
Interest Rate
5.83%
Mortgage Type
Purchase Money Mortgage
Purchase Details
Closed on
May 5, 2005
Sold by
Fayard Nancy L and Fayard Robert L
Bought by
Moore Robert and Moore Tracy
Purchase Details
Closed on
Dec 31, 1992
Sold by
Scalise Robert V and Scalise Mary S
Bought by
Fayard Robert L and Fayard Nancy L
Purchase Details
Closed on
Sep 28, 1989
Sold by
Baldiga Robert S
Bought by
Scalise Robert
Create a Home Valuation Report for This Property
The Home Valuation Report is an in-depth analysis detailing your home's value as well as a comparison with similar homes in the area
Home Values in the Area
Average Home Value in this Area
Purchase History
| Date | Buyer | Sale Price | Title Company |
|---|---|---|---|
| Childs Lt | -- | None Available | |
| Childs Lt | -- | None Available | |
| Childs Christopher | $412,500 | -- | |
| Primacy Closing Corp | $412,500 | -- | |
| Moore Robert | $457,000 | -- | |
| Fayard Robert L | $185,000 | -- | |
| Scalise Robert | $210,000 | -- | |
| Childs Christopher | $412,500 | -- | |
| Moore Robert | $457,000 | -- | |
| Fayard Robert L | $185,000 | -- | |
| Scalise Robert V | $210,000 | -- |
Source: Public Records
Mortgage History
| Date | Status | Borrower | Loan Amount |
|---|---|---|---|
| Previous Owner | Scalise Robert V | $321,000 | |
| Previous Owner | Childs Christopher | $330,000 |
Source: Public Records
Tax History Compared to Growth
Tax History
| Year | Tax Paid | Tax Assessment Tax Assessment Total Assessment is a certain percentage of the fair market value that is determined by local assessors to be the total taxable value of land and additions on the property. | Land | Improvement |
|---|---|---|---|---|
| 2025 | $7,081 | $563,800 | $181,300 | $382,500 |
| 2024 | $6,750 | $524,900 | $165,500 | $359,400 |
| 2023 | $6,505 | $498,500 | $157,700 | $340,800 |
| 2022 | $6,474 | $459,800 | $137,300 | $322,500 |
| 2021 | $6,261 | $434,500 | $137,300 | $297,200 |
| 2020 | $5,962 | $419,300 | $137,300 | $282,000 |
| 2019 | $5,837 | $410,800 | $137,300 | $273,500 |
| 2018 | $5,692 | $395,000 | $142,500 | $252,500 |
| 2017 | $5,530 | $385,600 | $142,500 | $243,100 |
| 2016 | $5,443 | $380,900 | $151,800 | $229,100 |
| 2015 | $5,218 | $366,200 | $145,900 | $220,300 |
| 2014 | $5,228 | $356,600 | $141,600 | $215,000 |
Source: Public Records
Map
Nearby Homes