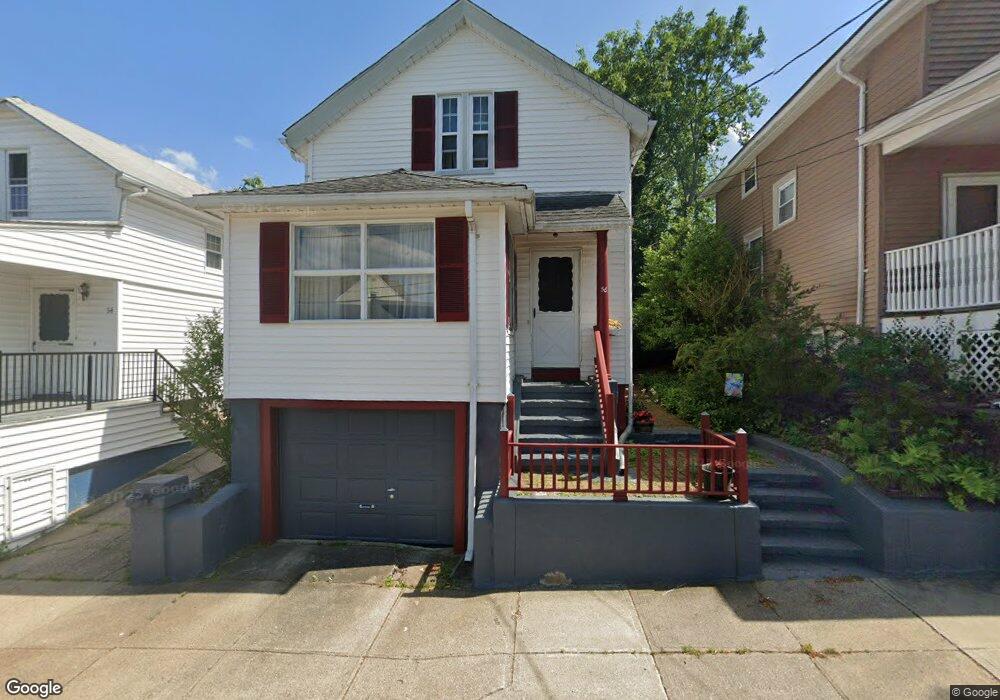
56 Gerald St Pawtucket, RI 02860
Oak Hill NeighborhoodEstimated Value: $338,000 - $432,000
2
Beds
2
Baths
1,320
Sq Ft
$284/Sq Ft
Est. Value
About This Home
This home is located at 56 Gerald St, Pawtucket, RI 02860 and is currently estimated at $374,744, approximately $283 per square foot. 56 Gerald St is a home located in Providence County with nearby schools including International Charter School, Blackstone Academy Charter School, and Ocean Tides School.
Ownership History
Date
Name
Owned For
Owner Type
Purchase Details
Closed on
Sep 24, 2001
Sold by
Carden Eugenie A
Bought by
Dowd Terrence F and Dowd Ann K
Current Estimated Value
Home Financials for this Owner
Home Financials are based on the most recent Mortgage that was taken out on this home.
Original Mortgage
$76,100
Outstanding Balance
$28,310
Interest Rate
6.98%
Estimated Equity
$346,434
Create a Home Valuation Report for This Property
The Home Valuation Report is an in-depth analysis detailing your home's value as well as a comparison with similar homes in the area
Home Values in the Area
Average Home Value in this Area
Purchase History
| Date | Buyer | Sale Price | Title Company |
|---|---|---|---|
| Dowd Terrence F | $101,500 | -- |
Source: Public Records
Mortgage History
| Date | Status | Borrower | Loan Amount |
|---|---|---|---|
| Open | Dowd Terrence F | $76,100 | |
| Previous Owner | Dowd Terrence F | $75,000 | |
| Previous Owner | Dowd Terrence F | $61,000 |
Source: Public Records
Tax History
| Year | Tax Paid | Tax Assessment Tax Assessment Total Assessment is a certain percentage of the fair market value that is determined by local assessors to be the total taxable value of land and additions on the property. | Land | Improvement |
|---|---|---|---|---|
| 2025 | $2,911 | $221,400 | $101,200 | $120,200 |
| 2024 | $2,732 | $221,400 | $101,200 | $120,200 |
| 2023 | $2,866 | $169,200 | $67,500 | $101,700 |
| 2022 | $2,805 | $169,200 | $67,500 | $101,700 |
| 2021 | $2,805 | $169,200 | $67,500 | $101,700 |
| 2020 | $2,651 | $126,900 | $56,200 | $70,700 |
| 2019 | $2,651 | $126,900 | $56,200 | $70,700 |
| 2018 | $2,554 | $126,900 | $56,200 | $70,700 |
| 2017 | $2,640 | $116,200 | $57,500 | $58,700 |
| 2016 | $2,544 | $116,200 | $57,500 | $58,700 |
| 2015 | $2,544 | $116,200 | $57,500 | $58,700 |
| 2014 | $2,661 | $115,400 | $65,700 | $49,700 |
Source: Public Records
Map
Nearby Homes
- 50 Jefferson Ave
- 54 Jefferson Ave
- 126 Dunnell Ave
- 159 Dunnell Ave
- 349 Pleasant St
- 167 George St
- 163 West Ave
- 5 Brown St
- 44 Pawtucket Ave
- 107 Mulberry St
- 187 Sisson St
- 59 West Ave
- 57 Garden St
- 45 Harrison St
- 122 Lowden St
- 158 Newell Ave
- 76 Slater St
- 193 Harrison St
- 333 School St Unit 109
- 41 Campbell Terrace
- 54 Gerald St
- 43 Highland St
- 50 Gerald St
- 30 Waldo St
- 26 Waldo St
- 46 Gerald St
- 42 Gerald St
- 39 Highland St
- 0 Gerald St
- 12 Waldo St
- 48 Highland St
- 38 Gerald St
- 36 Waldo St
- 36 Highland St
- 36 Highland St
- 36 Highland St Unit 3
- 36 Highland St Unit 3rd Flr
- 36 Highland St Unit 1
- 36 Highland St Unit 2nd Flr
- 44 Highland St Unit 2
Your Personal Tour Guide
Ask me questions while you tour the home.