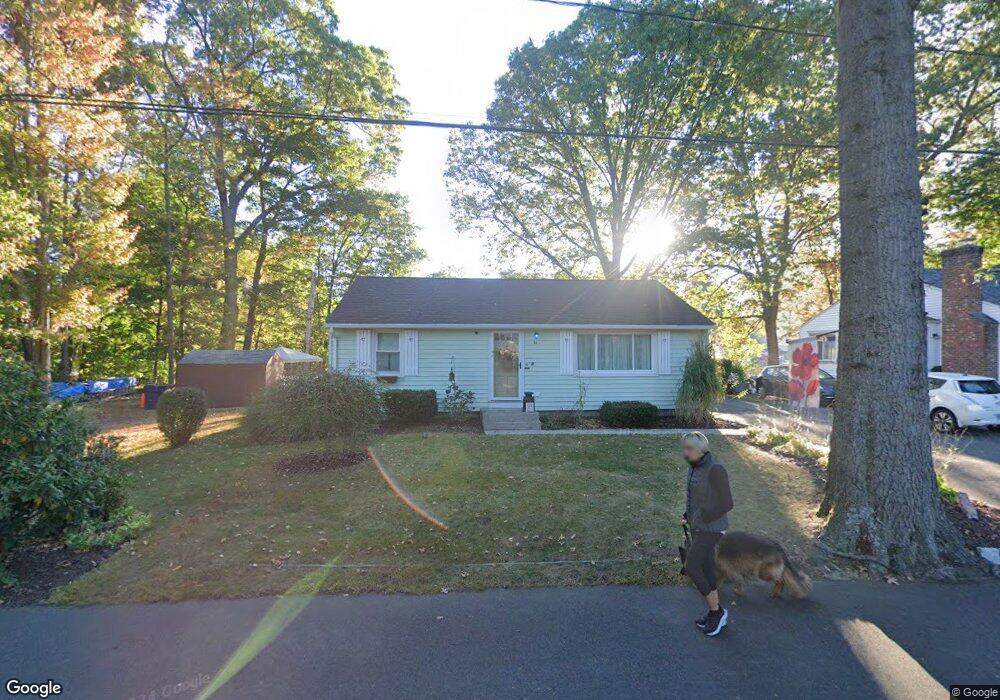
56 Grant Ave Plainville, CT 06062
Estimated Value: $305,354 - $375,000
3
Beds
2
Baths
1,230
Sq Ft
$272/Sq Ft
Est. Value
About This Home
This home is located at 56 Grant Ave, Plainville, CT 06062 and is currently estimated at $335,089, approximately $272 per square foot. 56 Grant Ave is a home located in Hartford County with nearby schools including Middle School Of Plainville, Plainville High School, and Great Beginnings.
Ownership History
Date
Name
Owned For
Owner Type
Purchase Details
Closed on
Oct 24, 2011
Sold by
Masse Melvin J and Masse James J
Bought by
Masse James J and Masse Joyce M
Current Estimated Value
Purchase Details
Closed on
Feb 19, 1999
Sold by
Masse Yvonne M
Bought by
Masse Melvin J and Masse Gary D
Create a Home Valuation Report for This Property
The Home Valuation Report is an in-depth analysis detailing your home's value as well as a comparison with similar homes in the area
Home Values in the Area
Average Home Value in this Area
Purchase History
| Date | Buyer | Sale Price | Title Company |
|---|---|---|---|
| Masse James J | -- | -- | |
| Masse James J | -- | -- | |
| Masse Melvin J | $120,000 | -- | |
| Masse Melvin J | $120,000 | -- |
Source: Public Records
Mortgage History
| Date | Status | Borrower | Loan Amount |
|---|---|---|---|
| Open | Masse Melvin J | $146,163 | |
| Closed | Masse Melvin J | $109,500 | |
| Closed | Masse Melvin J | $91,702 |
Source: Public Records
Tax History Compared to Growth
Tax History
| Year | Tax Paid | Tax Assessment Tax Assessment Total Assessment is a certain percentage of the fair market value that is determined by local assessors to be the total taxable value of land and additions on the property. | Land | Improvement |
|---|---|---|---|---|
| 2025 | $4,414 | $128,450 | $53,340 | $75,110 |
| 2024 | $4,193 | $128,450 | $53,340 | $75,110 |
| 2023 | $4,036 | $128,450 | $53,340 | $75,110 |
| 2022 | $3,936 | $128,450 | $53,340 | $75,110 |
| 2021 | $3,747 | $108,430 | $46,340 | $62,090 |
| 2020 | $3,754 | $108,430 | $46,340 | $62,090 |
| 2019 | $3,754 | $108,430 | $46,340 | $62,090 |
| 2018 | $3,669 | $108,430 | $46,340 | $62,090 |
| 2017 | $3,543 | $108,430 | $46,340 | $62,090 |
| 2016 | $3,881 | $121,310 | $49,280 | $72,030 |
| 2015 | $3,861 | $121,310 | $49,280 | $72,030 |
| 2014 | $4,615 | $147,070 | $49,980 | $97,090 |
Source: Public Records
Map
Nearby Homes
- 98 Rockwell Ave
- 135 New Britain Ave Unit 24
- 242 Farmington Ave
- 53 Birch Tree Rd
- 98 Cooke St
- 97 Trumbull Ave
- 48 Plum Tree Rd
- 3 Grant Ave
- 15 Maiden Ln
- 276 Cooke St
- 17 Farmington Ave Unit 15
- 365 Woodford Ave Unit 6
- 77 E Main St
- 36 Milford St
- 27 School St
- 31 E Broad St
- 97 Dallas Ave Unit A4
- 20 Macarthur Rd
- 17 Laurel St
- 0 Lot 36 Unit 24121321
- 178 Rockwell Ave
- 184 Rockwell Ave
- 172 Rockwell Ave
- 170 Rockwell Ave
- 54 Grant Ave
- 55 Cottage St
- 181 Rockwell Ave
- 175 Rockwell Ave
- 164 Rockwell Ave
- 41 Grant Ave
- 173 Rockwell Ave
- 53 Cottage St
- 163 Rockwell Ave
- 156 Rockwell Ave
- 45 Cottage St
- 41 Cottage St
- 39 Grant Ave
- 56 Madison St
- 150 Rockwell Ave
- 176 Trumbull Ave