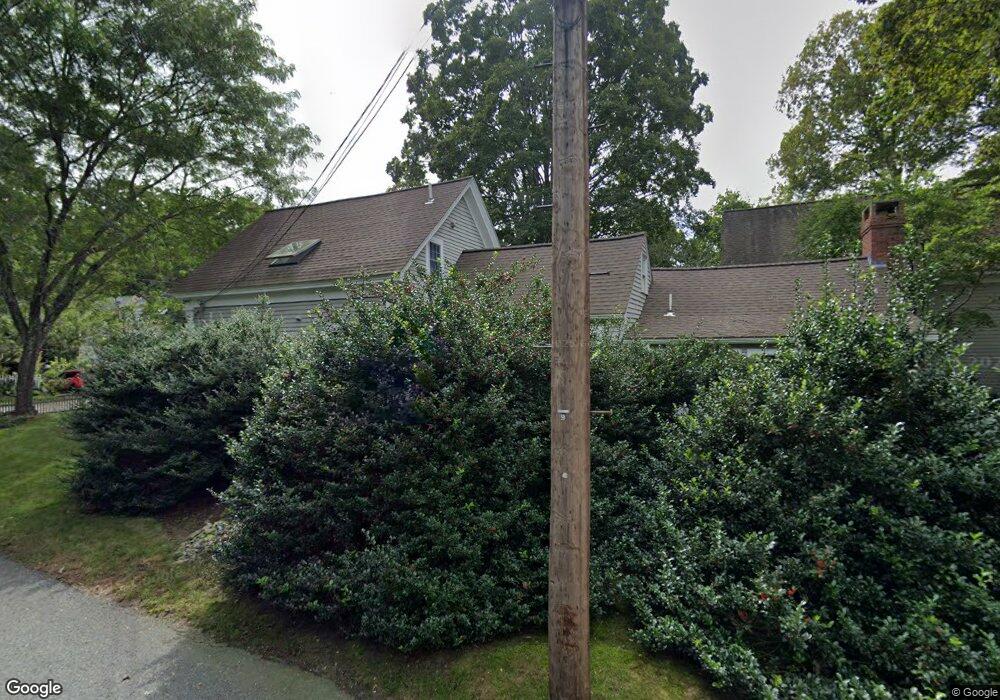
56 Grove St Holliston, MA 01746
Estimated Value: $843,745 - $993,000
3
Beds
3
Baths
2,519
Sq Ft
$370/Sq Ft
Est. Value
About This Home
This home is located at 56 Grove St, Holliston, MA 01746 and is currently estimated at $931,436, approximately $369 per square foot. 56 Grove St is a home located in Middlesex County with nearby schools including Miller Elementary School, Robert H. Adams Middle School, and Holliston High School.
Ownership History
Date
Name
Owned For
Owner Type
Purchase Details
Closed on
Aug 16, 2010
Sold by
Green Brian J and Green Susan E
Bought by
Oneill Bryan M and Oneill Jennifer C
Current Estimated Value
Home Financials for this Owner
Home Financials are based on the most recent Mortgage that was taken out on this home.
Original Mortgage
$424,000
Outstanding Balance
$281,578
Interest Rate
4.63%
Mortgage Type
Purchase Money Mortgage
Estimated Equity
$649,858
Purchase Details
Closed on
Aug 19, 1994
Sold by
Porter Dorothy M
Bought by
Green Brian J and Green Susan E
Create a Home Valuation Report for This Property
The Home Valuation Report is an in-depth analysis detailing your home's value as well as a comparison with similar homes in the area
Home Values in the Area
Average Home Value in this Area
Purchase History
| Date | Buyer | Sale Price | Title Company |
|---|---|---|---|
| Oneill Bryan M | $530,000 | -- | |
| Green Brian J | $148,500 | -- |
Source: Public Records
Mortgage History
| Date | Status | Borrower | Loan Amount |
|---|---|---|---|
| Open | Oneill Bryan M | $424,000 | |
| Previous Owner | Green Brian J | $100,000 | |
| Previous Owner | Green Brian J | $189,000 | |
| Previous Owner | Green Brian J | $167,500 |
Source: Public Records
Tax History Compared to Growth
Tax History
| Year | Tax Paid | Tax Assessment Tax Assessment Total Assessment is a certain percentage of the fair market value that is determined by local assessors to be the total taxable value of land and additions on the property. | Land | Improvement |
|---|---|---|---|---|
| 2025 | $12,762 | $871,100 | $254,600 | $616,500 |
| 2024 | $11,667 | $774,700 | $254,600 | $520,100 |
| 2023 | $10,330 | $670,800 | $254,600 | $416,200 |
| 2022 | $10,951 | $630,100 | $254,600 | $375,500 |
| 2021 | $10,858 | $608,300 | $189,400 | $418,900 |
| 2020 | $10,833 | $574,700 | $200,600 | $374,100 |
| 2019 | $10,496 | $557,400 | $191,000 | $366,400 |
| 2018 | $10,407 | $557,400 | $191,000 | $366,400 |
| 2017 | $9,762 | $527,100 | $196,800 | $330,300 |
| 2016 | $10,229 | $544,400 | $187,100 | $357,300 |
| 2015 | $10,281 | $530,500 | $162,500 | $368,000 |
Source: Public Records
Map
Nearby Homes
- 1366 Washington St
- 154 Union St
- 156 Mitchell Rd
- 11 Francine Dr
- 160 Winter St
- 43 Bittersweet Cir Unit 43
- 1037 Washington St
- 1014 Highland St
- 54 Westfield Dr
- 195 High St
- 56 Roy Ave
- 32 Colonial Way
- 266 Willowgate Rise
- 131 Jennings Rd
- 625 Norfolk St
- 150 Westfield Dr
- 133 Brooksmont Dr Unit 43
- 95 Brooksmont Dr Unit 26
- 30 Powderhorn Ln
- 121 Bullard St