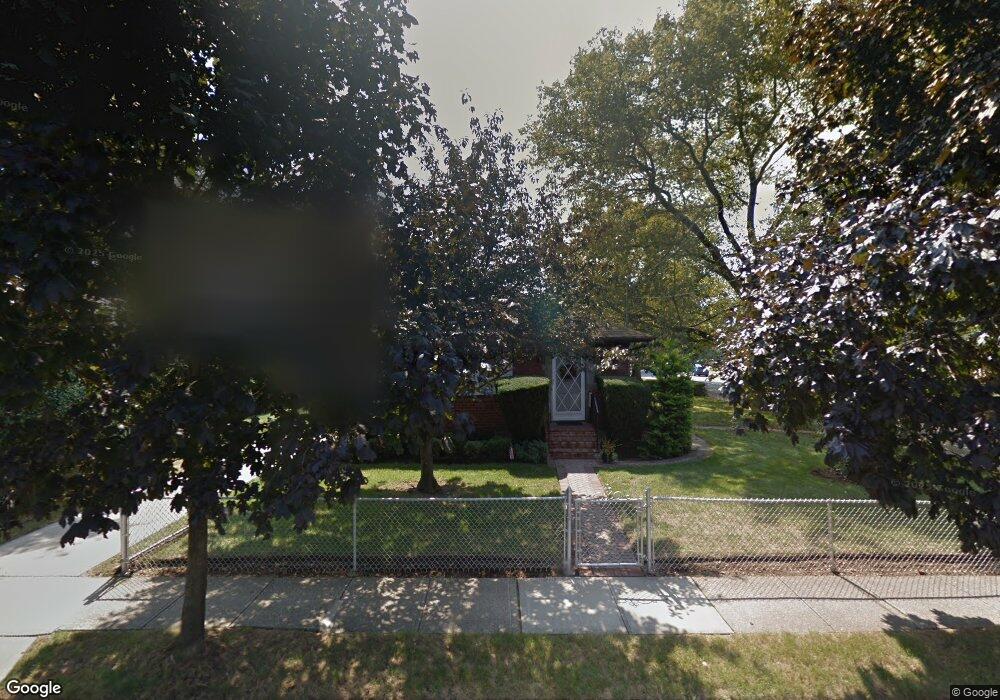
56 Harold Ave Hempstead, NY 11550
Estimated Value: $605,574 - $686,000
3
Beds
1
Bath
1,222
Sq Ft
$528/Sq Ft
Est. Value
About This Home
This home is located at 56 Harold Ave, Hempstead, NY 11550 and is currently estimated at $645,787, approximately $528 per square foot. 56 Harold Ave is a home located in Nassau County with nearby schools including Grand Avenue Elementary School, Lawrence Road Middle School, and Uniondale High School.
Ownership History
Date
Name
Owned For
Owner Type
Purchase Details
Closed on
Sep 22, 2021
Sold by
Singh Brandon and Taylor Floyd
Bought by
Singh Brandon
Current Estimated Value
Purchase Details
Closed on
Apr 21, 2021
Sold by
Baluchinsky Ellen M and Baluchinsky Joanne M
Bought by
Singh Brandon and Taylor Flyod
Home Financials for this Owner
Home Financials are based on the most recent Mortgage that was taken out on this home.
Original Mortgage
$410,428
Outstanding Balance
$370,365
Interest Rate
3.1%
Mortgage Type
FHA
Estimated Equity
$275,422
Create a Home Valuation Report for This Property
The Home Valuation Report is an in-depth analysis detailing your home's value as well as a comparison with similar homes in the area
Home Values in the Area
Average Home Value in this Area
Purchase History
| Date | Buyer | Sale Price | Title Company |
|---|---|---|---|
| Singh Brandon | -- | None Available | |
| Singh Brandon | -- | None Available | |
| Singh Brandon | -- | None Available | |
| Singh Brandon | $418,000 | None Available | |
| Singh Brandon | $418,000 | None Available | |
| Singh Brandon | $418,000 | None Available |
Source: Public Records
Mortgage History
| Date | Status | Borrower | Loan Amount |
|---|---|---|---|
| Open | Singh Brandon | $410,428 | |
| Closed | Singh Brandon | $410,428 |
Source: Public Records
Tax History
| Year | Tax Paid | Tax Assessment Tax Assessment Total Assessment is a certain percentage of the fair market value that is determined by local assessors to be the total taxable value of land and additions on the property. | Land | Improvement |
|---|---|---|---|---|
| 2025 | $6,091 | $350 | $161 | $189 |
| 2024 | $896 | $334 | $154 | $180 |
Source: Public Records
Map
Nearby Homes
- 248 Kennedy Ave
- 95 Harold Ave
- 225 Windsor Pkwy
- 34 Heath Place
- 48 Cliff Ave
- 30 Pierson Ave
- 244 Brown Ave
- 141 Booth St
- 138 Windsor Pkwy
- 39 Acacia Ave
- 15 Clyde Ave
- 34 Frazier St
- 7 Bernhard St
- 182 Long Beach Rd
- 44 Nassau Pkwy
- 101 Baldwin Rd
- 3 Tompkins Place
- 29 Sterling Place
- 23 Peters Ave
- 19 Hamilton Place
- 62 Harold Ave Unit whole house
- 249 Kennedy Ave
- 68 Harold Ave
- 48 Harold Ave
- 253 Kennedy Ave
- 231 Kennedy Ave
- 47 Harold Ave
- 15 Cleaves Ave
- 72 Harold Ave
- 259 Kennedy Ave
- 44 Harold Ave
- 230 Kennedy Ave
- 63 Harold Ave
- 19 Cleaves Ave
- 254 Kennedy Ave
- 263 Kennedy Ave
- 225 Kennedy Ave
- 226 Kennedy Ave
- 69 Harold Ave
- 40 Harold Ave
Your Personal Tour Guide
Ask me questions while you tour the home.