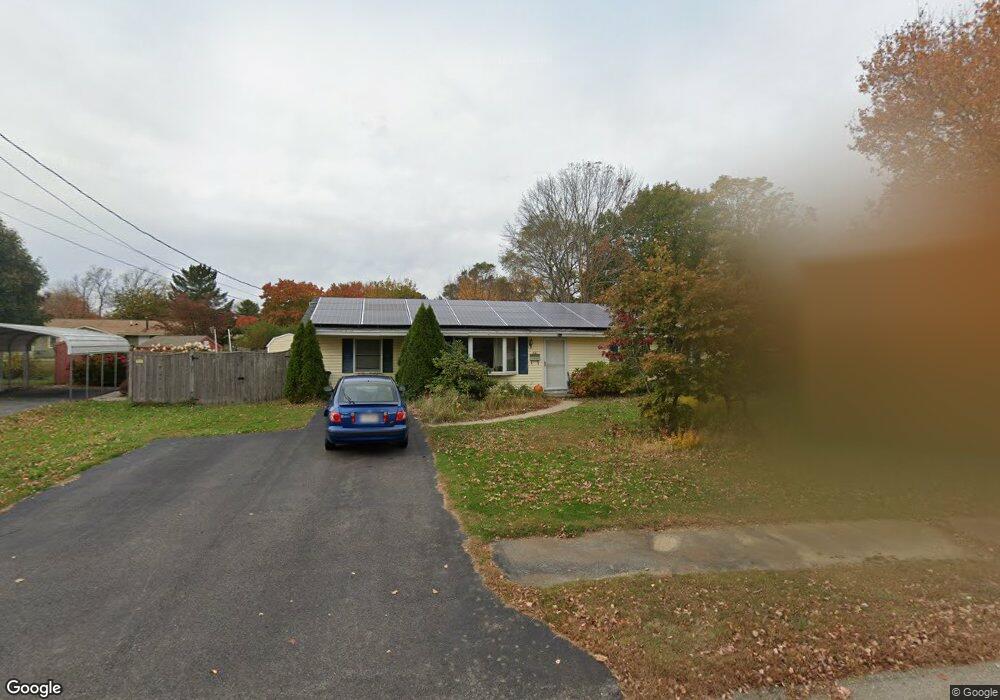
56 Hopkins Rd Brockton, MA 02302
Estimated Value: $451,000 - $484,000
3
Beds
1
Bath
1,008
Sq Ft
$464/Sq Ft
Est. Value
About This Home
This home is located at 56 Hopkins Rd, Brockton, MA 02302 and is currently estimated at $467,605, approximately $463 per square foot. 56 Hopkins Rd is a home located in Plymouth County with nearby schools including Davis K-8 School, John F. Kennedy Elementary School, and South Middle School.
Ownership History
Date
Name
Owned For
Owner Type
Purchase Details
Closed on
Oct 3, 2013
Sold by
Zakszewski Joseph H and Zakszewski Frances M
Bought by
Zakszewski Ft
Current Estimated Value
Home Financials for this Owner
Home Financials are based on the most recent Mortgage that was taken out on this home.
Original Mortgage
$85,000
Outstanding Balance
$64,069
Interest Rate
4.58%
Estimated Equity
$403,536
Create a Home Valuation Report for This Property
The Home Valuation Report is an in-depth analysis detailing your home's value as well as a comparison with similar homes in the area
Home Values in the Area
Average Home Value in this Area
Purchase History
| Date | Buyer | Sale Price | Title Company |
|---|---|---|---|
| Zakszewski Ft | -- | -- |
Source: Public Records
Mortgage History
| Date | Status | Borrower | Loan Amount |
|---|---|---|---|
| Open | Zakszewski Ft | $85,000 |
Source: Public Records
Tax History Compared to Growth
Tax History
| Year | Tax Paid | Tax Assessment Tax Assessment Total Assessment is a certain percentage of the fair market value that is determined by local assessors to be the total taxable value of land and additions on the property. | Land | Improvement |
|---|---|---|---|---|
| 2025 | $4,498 | $371,400 | $161,700 | $209,700 |
| 2024 | $4,435 | $369,000 | $161,700 | $207,300 |
| 2023 | $4,212 | $324,500 | $112,000 | $212,500 |
| 2022 | $4,128 | $295,500 | $101,800 | $193,700 |
| 2021 | $3,870 | $266,900 | $95,000 | $171,900 |
| 2020 | $3,971 | $262,100 | $83,200 | $178,900 |
| 2019 | $3,495 | $224,900 | $79,600 | $145,300 |
| 2018 | $3,446 | $214,600 | $79,600 | $135,000 |
| 2017 | $2,872 | $178,400 | $79,600 | $98,800 |
| 2016 | $3,338 | $192,300 | $75,900 | $116,400 |
| 2015 | $2,875 | $158,400 | $75,900 | $82,500 |
| 2014 | $3,106 | $171,300 | $75,900 | $95,400 |
Source: Public Records
Map
Nearby Homes