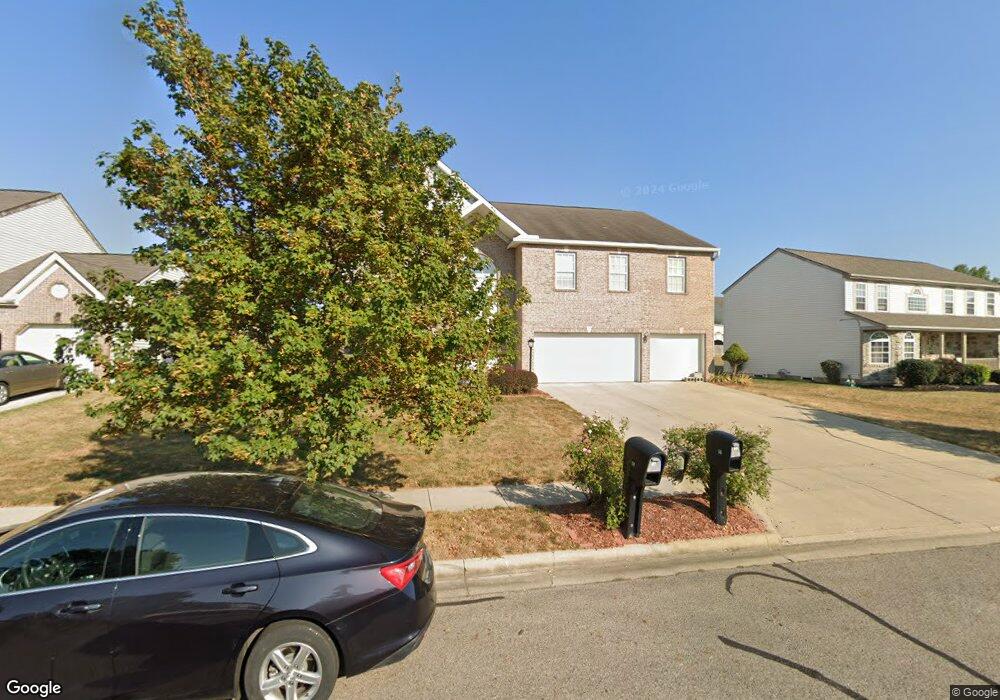
56 Langtree Dr Pickerington, OH 43147
Estimated Value: $466,000 - $533,000
6
Beds
6
Baths
3,824
Sq Ft
$132/Sq Ft
Est. Value
About This Home
This home is located at 56 Langtree Dr, Pickerington, OH 43147 and is currently estimated at $503,582, approximately $131 per square foot. 56 Langtree Dr is a home located in Fairfield County with nearby schools including Pickerington Elementary School, Diley Middle School, and Pickerington Ridgeview Junior High School.
Ownership History
Date
Name
Owned For
Owner Type
Purchase Details
Closed on
Sep 28, 2005
Sold by
Maronda Homes Inc Of Ohio
Bought by
Johnson Dennis L and Brown Johnson Patience Y
Current Estimated Value
Home Financials for this Owner
Home Financials are based on the most recent Mortgage that was taken out on this home.
Original Mortgage
$236,692
Outstanding Balance
$128,043
Interest Rate
5.93%
Mortgage Type
Fannie Mae Freddie Mac
Estimated Equity
$375,539
Create a Home Valuation Report for This Property
The Home Valuation Report is an in-depth analysis detailing your home's value as well as a comparison with similar homes in the area
Home Values in the Area
Average Home Value in this Area
Purchase History
| Date | Buyer | Sale Price | Title Company |
|---|---|---|---|
| Johnson Dennis L | $249,200 | -- |
Source: Public Records
Mortgage History
| Date | Status | Borrower | Loan Amount |
|---|---|---|---|
| Open | Johnson Dennis L | $236,692 |
Source: Public Records
Tax History Compared to Growth
Tax History
| Year | Tax Paid | Tax Assessment Tax Assessment Total Assessment is a certain percentage of the fair market value that is determined by local assessors to be the total taxable value of land and additions on the property. | Land | Improvement |
|---|---|---|---|---|
| 2024 | $17,010 | $138,180 | $11,990 | $126,190 |
| 2023 | $6,515 | $138,180 | $11,990 | $126,190 |
| 2022 | $6,536 | $138,180 | $11,990 | $126,190 |
| 2021 | $5,782 | $104,100 | $11,990 | $92,110 |
| 2020 | $5,845 | $104,100 | $11,990 | $92,110 |
| 2019 | $5,882 | $104,100 | $11,990 | $92,110 |
| 2018 | $5,765 | $90,930 | $11,990 | $78,940 |
| 2017 | $5,773 | $88,940 | $10,000 | $78,940 |
| 2016 | $5,744 | $88,940 | $10,000 | $78,940 |
| 2015 | $5,630 | $82,420 | $10,000 | $72,420 |
| 2014 | $5,562 | $82,420 | $10,000 | $72,420 |
| 2013 | $5,562 | $82,420 | $10,000 | $72,420 |
Source: Public Records
Map
Nearby Homes
- 48 Langtree Dr
- 783 W Columbus St
- 350 Diley Rd
- 136 Pioneer Cir
- 248 Pioneer Cir Unit 248
- 148 Georges Creek Dr
- 147 Georges Creek Dr
- 352 Evergreen Cir
- 545 W Columbus St
- 104 Monebrake Dr
- 140 Robinette St
- Pendleton Plan at Longview Highlands
- Stamford Plan at Longview Highlands
- Bellamy Plan at Longview Highlands
- Newcastle Plan at Longview Highlands
- Chatham Plan at Longview Highlands
- Sienna Plan at Longview Highlands
- Harmony Plan at Longview Highlands
- Henley Plan at Longview Highlands
- 675 Preston Trails Dr
- 60 Langtree Dr
- 52 Langtree Dr
- 51 Grisby Ln
- 55 Grisby Ln
- 49 Grisby Ln
- 64 Langtree Dr
- 64 Langtree Dr Unit 83
- 51 Langtree Dr
- 47 Langtree Dr
- 59 Grisby Ln
- 45 Grisby Ln
- 43 Langtree Dr
- 59 Langtree Dr
- 59 Langtree Dr Unit Lot 63
- 44 Langtree Dr
- 44 Langtree Dr Unit 78
- 39 Langtree Dr
- 42 Grisby Ln
- 46 Grisby Ln
- 54 Knights Bridge Dr W