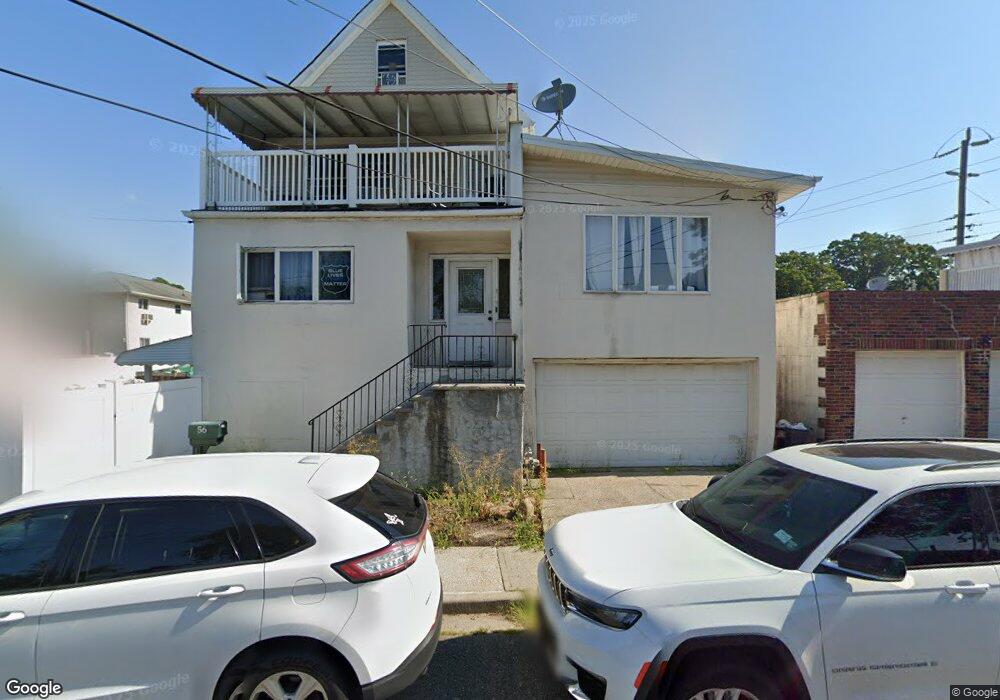
56 M St Unit Upper Elmont, NY 11003
Estimated Value: $750,998 - $851,000
3
Beds
1
Bath
1,896
Sq Ft
$416/Sq Ft
Est. Value
About This Home
This home is located at 56 M St Unit Upper, Elmont, NY 11003 and is currently estimated at $789,500, approximately $416 per square foot. 56 M St Unit Upper is a home located in Nassau County with nearby schools including Cheder at the Ohel.
Ownership History
Date
Name
Owned For
Owner Type
Purchase Details
Closed on
Nov 24, 2010
Sold by
Bocchino Frances
Bought by
Gandolfo Lauren
Current Estimated Value
Purchase Details
Closed on
Dec 15, 2009
Sold by
Bocchino Frances
Bought by
Bocchino Frances and Gandolfo Lauren
Purchase Details
Closed on
Nov 10, 2009
Sold by
Gandolfo Monique and Versace Mark
Bought by
Bocchino Frances
Purchase Details
Closed on
Feb 15, 2006
Sold by
Gandolfo Monique
Purchase Details
Closed on
Apr 16, 2002
Sold by
Giulio Zoffraniere and Giulio Mary Jane
Bought by
Gandolfo Monique
Create a Home Valuation Report for This Property
The Home Valuation Report is an in-depth analysis detailing your home's value as well as a comparison with similar homes in the area
Home Values in the Area
Average Home Value in this Area
Purchase History
| Date | Buyer | Sale Price | Title Company |
|---|---|---|---|
| Gandolfo Lauren | -- | -- | |
| Bocchino Frances | -- | -- | |
| Bocchino Frances | $200,000 | -- | |
| -- | -- | -- | |
| Gandolfo Monique | $255,000 | Jeffrey Leavitt |
Source: Public Records
Tax History Compared to Growth
Tax History
| Year | Tax Paid | Tax Assessment Tax Assessment Total Assessment is a certain percentage of the fair market value that is determined by local assessors to be the total taxable value of land and additions on the property. | Land | Improvement |
|---|---|---|---|---|
| 2025 | $12,998 | $526 | $187 | $339 |
| 2024 | $4,371 | $515 | $183 | $332 |
| 2023 | $11,800 | $526 | $187 | $339 |
| 2022 | $11,800 | $526 | $187 | $339 |
| 2021 | $15,171 | $504 | $179 | $325 |
| 2020 | $10,864 | $581 | $513 | $68 |
| 2019 | $10,051 | $622 | $392 | $230 |
| 2017 | $8,576 | $872 | $549 | $323 |
| 2016 | $13,037 | $872 | $549 | $323 |
| 2015 | $4,150 | $872 | $549 | $323 |
| 2014 | $4,150 | $872 | $549 | $323 |
| 2013 | $3,892 | $872 | $549 | $323 |
Source: Public Records
Map
Nearby Homes