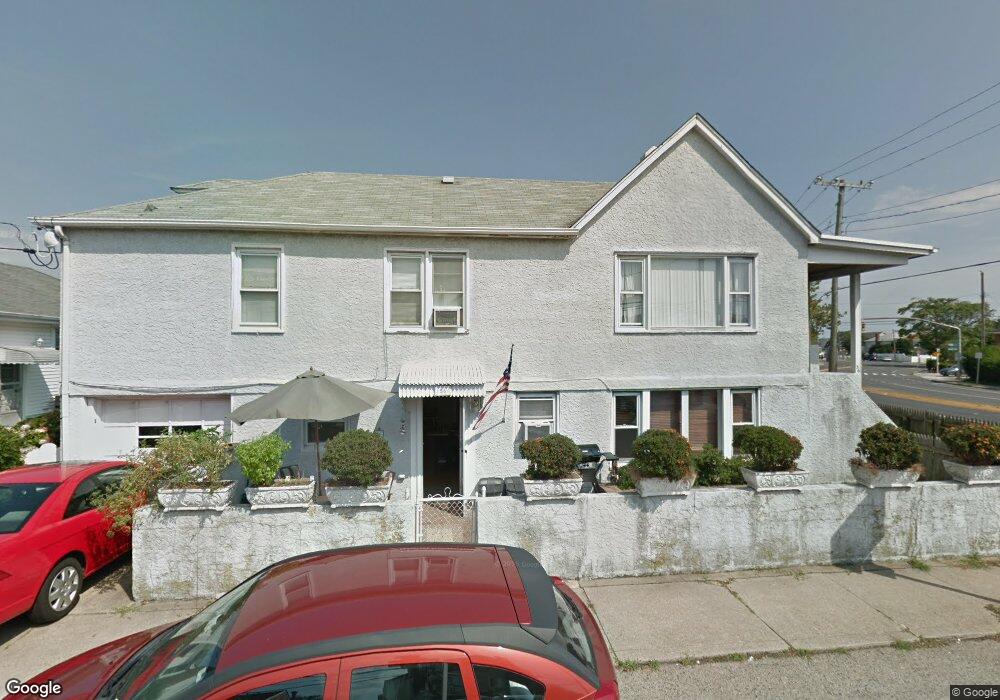
56 Malone Ave Unit Upper East Atlantic Beach, NY 11561
Estimated Value: $829,255 - $1,077,000
3
Beds
1
Bath
1,102
Sq Ft
$865/Sq Ft
Est. Value
About This Home
This home is located at 56 Malone Ave Unit Upper, East Atlantic Beach, NY 11561 and is currently estimated at $953,128, approximately $864 per square foot. 56 Malone Ave Unit Upper is a home located in Nassau County with nearby schools including Lido Elementary School, West Elementary School, and Lindell Elementary School.
Ownership History
Date
Name
Owned For
Owner Type
Purchase Details
Closed on
Jun 30, 2018
Sold by
Drinkwater Gregory and Tarpey Megan Drinkwater
Bought by
Petschauer John
Current Estimated Value
Home Financials for this Owner
Home Financials are based on the most recent Mortgage that was taken out on this home.
Original Mortgage
$400,000
Outstanding Balance
$346,660
Interest Rate
4.5%
Mortgage Type
New Conventional
Estimated Equity
$606,468
Purchase Details
Closed on
Dec 3, 2007
Sold by
Murray James
Bought by
Drinkwater Gregory
Create a Home Valuation Report for This Property
The Home Valuation Report is an in-depth analysis detailing your home's value as well as a comparison with similar homes in the area
Home Values in the Area
Average Home Value in this Area
Purchase History
| Date | Buyer | Sale Price | Title Company |
|---|---|---|---|
| Petschauer John | $679,000 | Security Title | |
| Drinkwater Gregory | $545,000 | -- |
Source: Public Records
Mortgage History
| Date | Status | Borrower | Loan Amount |
|---|---|---|---|
| Open | Petschauer John | $400,000 |
Source: Public Records
Tax History Compared to Growth
Tax History
| Year | Tax Paid | Tax Assessment Tax Assessment Total Assessment is a certain percentage of the fair market value that is determined by local assessors to be the total taxable value of land and additions on the property. | Land | Improvement |
|---|---|---|---|---|
| 2025 | $11,267 | $541 | $269 | $272 |
| 2024 | $4,169 | $520 | $262 | $258 |
| 2023 | $10,349 | $503 | $253 | $250 |
| 2022 | $10,349 | $562 | $283 | $279 |
| 2021 | $11,858 | $552 | $278 | $274 |
| 2020 | $12,358 | $962 | $631 | $331 |
| 2019 | $4,531 | $962 | $631 | $331 |
| 2018 | $7,219 | $962 | $0 | $0 |
| 2017 | $6,401 | $962 | $631 | $331 |
| 2016 | $10,582 | $962 | $631 | $331 |
| 2015 | $3,997 | $962 | $631 | $331 |
| 2014 | $3,997 | $962 | $631 | $331 |
| 2013 | $3,947 | $962 | $631 | $331 |
Source: Public Records
Map
Nearby Homes