Estimated Value: $1,477,407 - $1,522,000
3
Beds
2
Baths
2,257
Sq Ft
$665/Sq Ft
Est. Value
About This Home
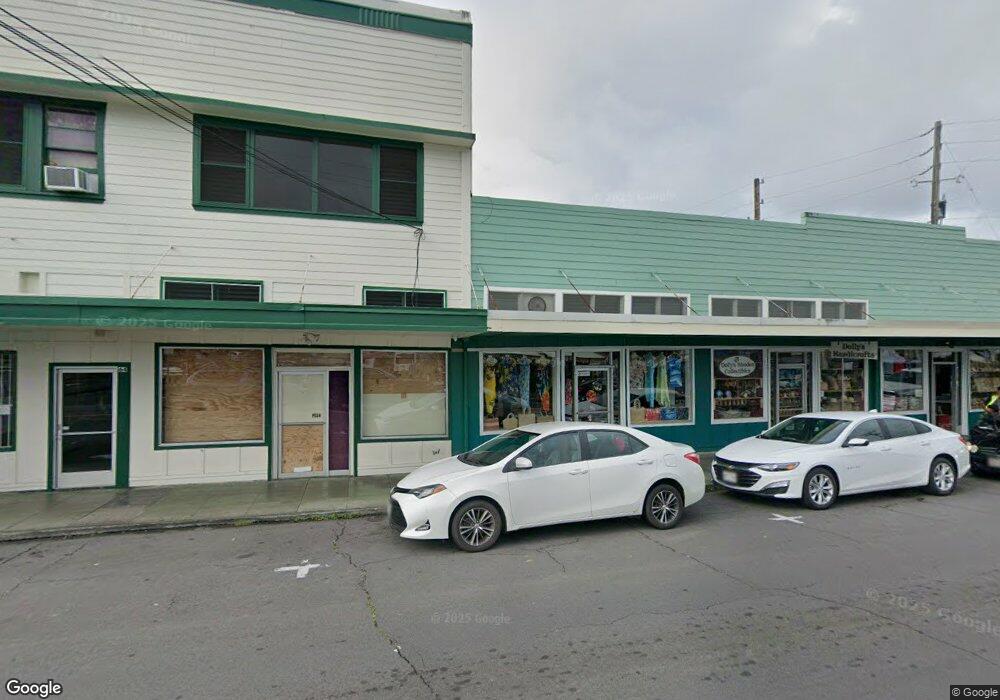
This home is located at 56 Mamo St Unit 3195, Hilo, HI 96720 and is currently estimated at $1,501,602, approximately $665 per square foot. 56 Mamo St Unit 3195 is a home located in Hawaii County.
Ownership History
Date
Name
Owned For
Owner Type
Purchase Details
Closed on
Apr 14, 2025
Sold by
Joann A Green Restated Survivors Trust and Green Joann A
Bought by
Walker Stephen Bradley and Walker Janet K
Current Estimated Value
Purchase Details
Closed on
Nov 7, 2022
Sold by
William And Joann Green Joint Revocable
Bought by
Joann A Green Restated Survivors Trust
Purchase Details
Closed on
Jan 30, 2019
Sold by
Green William Edwin and Green Joann A
Bought by
Green William Edwin and Green Joann A
Purchase Details
Closed on
Feb 28, 2008
Sold by
Green William E and Altschuler Joann
Bought by
Green William Edwin and William Edwin Green Revocable Living Tr
Purchase Details
Closed on
Oct 16, 2001
Sold by
Short Thomas Odair and Short Janice Rae
Bought by
Green William E and Altschuler Joann
Purchase Details
Closed on
Aug 24, 1998
Sold by
Kawamura Rodney M and Kawamura Myra H
Bought by
Short Thomas Odair and Short Janice Rae
Purchase Details
Closed on
Jun 5, 1995
Sold by
Chalon International Of Hawaii Inc
Bought by
Kawamura Rodney M and Kawamura Myra H
Create a Home Valuation Report for This Property
The Home Valuation Report is an in-depth analysis detailing your home's value as well as a comparison with similar homes in the area
Home Values in the Area
Average Home Value in this Area
Purchase History
| Date | Buyer | Sale Price | Title Company |
|---|---|---|---|
| Walker Stephen Bradley | -- | Title Guaranty | |
| Joann A Green Restated Survivors Trust | -- | -- | |
| Green William Edwin | -- | None Available | |
| Green William Edwin | -- | None Available | |
| Green William Edwin | -- | None Available | |
| Green William E | $203,000 | -- | |
| Short Thomas Odair | $138,000 | -- | |
| Kawamura Rodney M | $86,200 | -- |
Source: Public Records
Tax History Compared to Growth
Tax History
| Year | Tax Paid | Tax Assessment Tax Assessment Total Assessment is a certain percentage of the fair market value that is determined by local assessors to be the total taxable value of land and additions on the property. | Land | Improvement |
|---|---|---|---|---|
| 2025 | $3,745 | $859,400 | $211,700 | $647,700 |
| 2024 | $3,745 | $834,400 | $211,700 | $622,700 |
| 2023 | $3,721 | $810,100 | $211,700 | $598,400 |
| 2022 | $3,730 | $786,500 | $211,700 | $574,800 |
| 2021 | $3,589 | $763,600 | $211,700 | $551,900 |
| 2020 | $3,453 | $741,400 | $211,700 | $529,700 |
| 2019 | $3,320 | $719,800 | $211,700 | $508,100 |
| 2018 | $3,191 | $698,800 | $211,700 | $487,100 |
| 2017 | $3,188 | $678,400 | $211,700 | $466,700 |
| 2016 | $3,066 | $658,600 | $211,700 | $446,900 |
| 2015 | -- | $639,400 | $211,700 | $427,700 |
| 2014 | -- | $620,800 | $197,100 | $423,700 |
Source: Public Records
Map
Nearby Homes
- 35-1183 Homestead Rd
- 34-1480 Honomainoa Rd
- 0 Spencer Rd
- 35-354 Pahale Rd
- 42-1467 Kalapahapuu Rd
- 32-520 Piha Kahuku Rd
- 35-194 Papa Aloa Ave
- 35-2080 Papa Aloa Ave
- 35-1655 Maulua Nui Rd
- 36-239 Manowaiopae Homestead Rd
- 35-219 Kihalani Homestead Rd
- 36-3358 Kuwili Lani Place
- 36-3326 Kuwili Lani Place
- 35-173 Kihalani Homestead Rd
- 36-136 Manowaiopae Homestead Rd
- 36-2335 Old Mamalahoa Hwy
- 36-2333 Old Mamalahoa Hwy
- 36-2331 Old Mamalahoa Hwy
- 35-2064 Old Mamalahoa Hwy
- 36-1070 Rd