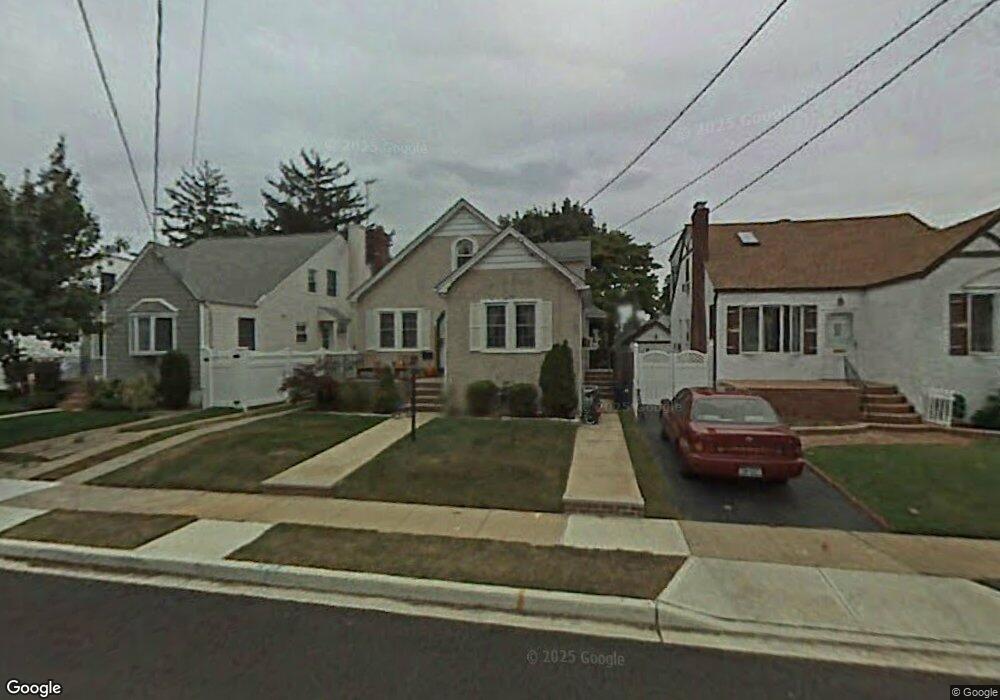
56 Maple St Massapequa, NY 11758
Estimated Value: $595,778 - $694,000
--
Bed
2
Baths
954
Sq Ft
$676/Sq Ft
Est. Value
About This Home
This home is located at 56 Maple St, Massapequa, NY 11758 and is currently estimated at $644,889, approximately $675 per square foot. 56 Maple St is a home located in Nassau County with nearby schools including Massapequa High School - Ames Campus, Berner Middle School, and Massapequa High School.
Ownership History
Date
Name
Owned For
Owner Type
Purchase Details
Closed on
Jul 2, 2009
Sold by
Battaglia Charles and Battaglia Jeanne
Bought by
Amesti James and Amesti Nicole
Current Estimated Value
Home Financials for this Owner
Home Financials are based on the most recent Mortgage that was taken out on this home.
Original Mortgage
$307,100
Outstanding Balance
$203,165
Interest Rate
5.58%
Mortgage Type
Purchase Money Mortgage
Estimated Equity
$441,724
Purchase Details
Closed on
Nov 24, 2003
Sold by
Mcdonnell Bridget
Bought by
Battaglia Charles
Purchase Details
Closed on
Oct 31, 2000
Sold by
Smith Jean Vivien
Bought by
Mcdonnell Bridget
Create a Home Valuation Report for This Property
The Home Valuation Report is an in-depth analysis detailing your home's value as well as a comparison with similar homes in the area
Home Values in the Area
Average Home Value in this Area
Purchase History
| Date | Buyer | Sale Price | Title Company |
|---|---|---|---|
| Amesti James | $383,900 | -- | |
| Battaglia Charles | $349,000 | -- | |
| Mcdonnell Bridget | $198,500 | Michael Ciaccio |
Source: Public Records
Mortgage History
| Date | Status | Borrower | Loan Amount |
|---|---|---|---|
| Open | Amesti James | $307,100 |
Source: Public Records
Tax History Compared to Growth
Tax History
| Year | Tax Paid | Tax Assessment Tax Assessment Total Assessment is a certain percentage of the fair market value that is determined by local assessors to be the total taxable value of land and additions on the property. | Land | Improvement |
|---|---|---|---|---|
| 2025 | $9,070 | $352 | $132 | $220 |
| 2024 | $2,864 | $356 | $134 | $222 |
| 2023 | $7,789 | $381 | $143 | $238 |
| 2022 | $7,789 | $375 | $141 | $234 |
| 2021 | $6,644 | $369 | $139 | $230 |
| 2020 | $5,580 | $359 | $358 | $1 |
| 2019 | $5,093 | $385 | $384 | $1 |
| 2018 | $5,073 | $410 | $0 | $0 |
| 2017 | $3,015 | $436 | $421 | $15 |
| 2016 | $5,136 | $461 | $394 | $67 |
| 2015 | $2,126 | $487 | $416 | $71 |
| 2014 | $2,126 | $487 | $416 | $71 |
| 2013 | $2,069 | $521 | $445 | $76 |
Source: Public Records
Map
Nearby Homes
- 54 Chestnut St
- 5675 Merrick Rd
- 17 Linden St
- 28 Grove St
- 243 Seaford Ave
- 230 W End Ave
- 4 Sutton Place
- 135 Ocean Ave
- 138 Saint Marks Place
- 3969 Marlow Ct
- 94 Alhambra Rd
- 3945 Hickory St
- 5 Canal Rd
- 344 Harrison Ave
- 3937 John Ln
- 37 Lakeshore Blvd
- 2067 Jackson Ave
- 43 Seabreeze Rd
- 3861 Hickory St
- 1872 Park Dr