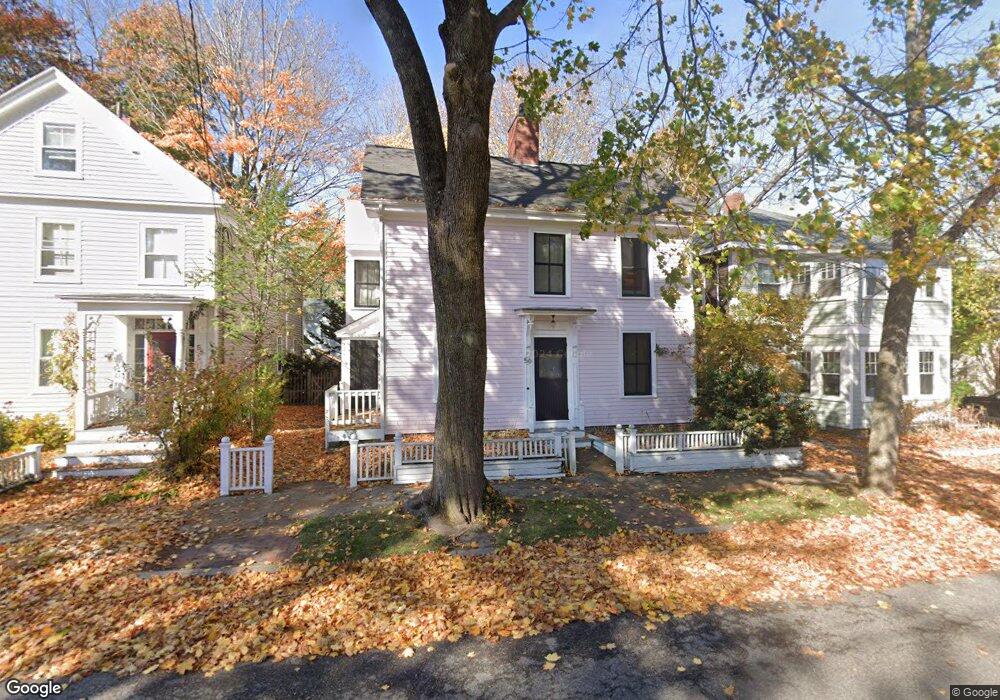
56 Marlboro St Newburyport, MA 01950
Estimated Value: $1,180,645 - $1,314,000
3
Beds
2
Baths
1,706
Sq Ft
$740/Sq Ft
Est. Value
About This Home
This home is located at 56 Marlboro St, Newburyport, MA 01950 and is currently estimated at $1,262,215, approximately $739 per square foot. 56 Marlboro St is a home located in Essex County with nearby schools including Francis T. Bresnahan Elementary School, Edward G. Molin Elementary School, and Rupert A. Nock Middle School.
Ownership History
Date
Name
Owned For
Owner Type
Purchase Details
Closed on
Oct 23, 1998
Sold by
Mccamic Hilary L
Bought by
Rossi John D and Dolberg Lynn E
Current Estimated Value
Purchase Details
Closed on
Aug 18, 1997
Sold by
Clausnitzer Arthur R and Clausnitzer Virginia
Bought by
Mccamic Hilary L
Create a Home Valuation Report for This Property
The Home Valuation Report is an in-depth analysis detailing your home's value as well as a comparison with similar homes in the area
Home Values in the Area
Average Home Value in this Area
Purchase History
| Date | Buyer | Sale Price | Title Company |
|---|---|---|---|
| Rossi John D | $285,000 | -- | |
| Mccamic Hilary L | $200,000 | -- |
Source: Public Records
Mortgage History
| Date | Status | Borrower | Loan Amount |
|---|---|---|---|
| Open | Mccamic Hilary L | $330,000 | |
| Closed | Mccamic Hilary L | $50,000 | |
| Closed | Mccamic Hilary L | $366,800 |
Source: Public Records
Tax History Compared to Growth
Tax History
| Year | Tax Paid | Tax Assessment Tax Assessment Total Assessment is a certain percentage of the fair market value that is determined by local assessors to be the total taxable value of land and additions on the property. | Land | Improvement |
|---|---|---|---|---|
| 2025 | $9,155 | $955,600 | $477,900 | $477,700 |
| 2024 | $8,752 | $877,800 | $434,400 | $443,400 |
| 2023 | $8,543 | $795,400 | $377,700 | $417,700 |
| 2022 | $7,892 | $657,100 | $314,700 | $342,400 |
| 2021 | $7,489 | $592,500 | $286,200 | $306,300 |
| 2020 | $7,257 | $565,200 | $286,200 | $279,000 |
| 2019 | $7,453 | $569,800 | $286,200 | $283,600 |
| 2018 | $7,144 | $538,800 | $272,600 | $266,200 |
| 2017 | $6,955 | $517,100 | $259,600 | $257,500 |
| 2016 | $6,927 | $517,300 | $247,200 | $270,100 |
| 2015 | $6,901 | $517,300 | $247,200 | $270,100 |
Source: Public Records
Map
Nearby Homes
- 26 Beacon Ave
- 17 Madison St
- 113 Prospect St Unit B
- 4 Goodwin Ave
- 33 Union St
- 57 Lime St Unit 1
- 164 Water St Unit A
- 166 Water St Unit B
- 58 Lime St Unit 5
- 1 Lancaster Rd
- 42 Federal St Unit B
- 11 Orange St Unit 2
- 95 High St Unit 4
- 95 High St Unit 1
- 105 State St Unit 301
- 105 State St Unit 101
- 105 State St Unit 201
- 11 Charter St
- 1 Littles Ln
- 30-32 Water St Unit 4
- 52 Marlboro St Unit 54
- 52-54 Marlboro St
- 52-54 Marlboro St Unit 1
- 52 Marlboro St Unit 1
- 58 Marlboro St
- 50 Marlboro St
- 48 Marlboro St
- 5 Barton St
- 60 Marlboro St
- 1 Barton St
- 7 Barton St
- 47 Marlboro St
- 44 Marlboro St Unit 46
- 49 Marlboro St
- 30 Chestnut St Unit 32
- 9 Barton St
- 62 Marlboro St
- 43 Marlboro St
- 53 Marlboro St
- 11 Barton St