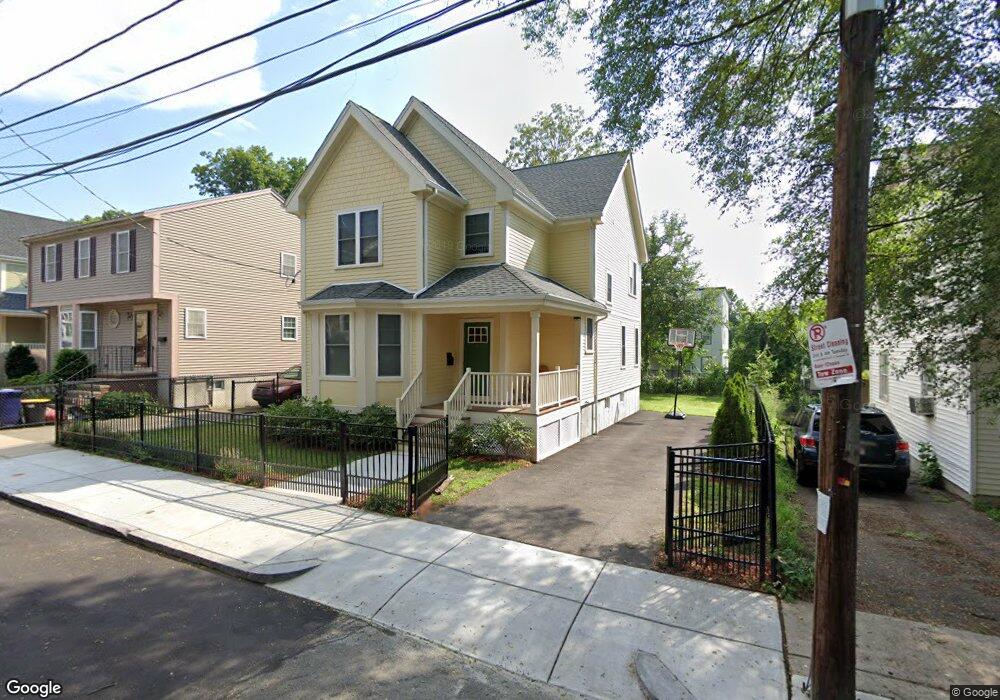
56 Mattapan St Boston, MA 02126
Wellington Hill NeighborhoodEstimated Value: $590,000 - $721,000
4
Beds
3
Baths
1,470
Sq Ft
$454/Sq Ft
Est. Value
About This Home
This home is located at 56 Mattapan St, Boston, MA 02126 and is currently estimated at $667,326, approximately $453 per square foot. 56 Mattapan St is a home located in Suffolk County with nearby schools including KIPP Academy Boston Charter School and Berea Seventh-day Adventist Academy.
Ownership History
Date
Name
Owned For
Owner Type
Purchase Details
Closed on
Aug 12, 1994
Sold by
Wood Ave Rt 56
Bought by
Stinson Johnny and Stinson Shirley
Current Estimated Value
Home Financials for this Owner
Home Financials are based on the most recent Mortgage that was taken out on this home.
Original Mortgage
$132,050
Interest Rate
8.52%
Mortgage Type
Purchase Money Mortgage
Purchase Details
Closed on
Jul 28, 1994
Sold by
Shorewood Fncl Inc
Bought by
Wood Ave Rt 56
Home Financials for this Owner
Home Financials are based on the most recent Mortgage that was taken out on this home.
Original Mortgage
$132,050
Interest Rate
8.52%
Mortgage Type
Purchase Money Mortgage
Purchase Details
Closed on
Jun 9, 1994
Sold by
Coppin Andrew and Foster Mtg Corp
Bought by
Foster Mtg Corp
Home Financials for this Owner
Home Financials are based on the most recent Mortgage that was taken out on this home.
Original Mortgage
$85,000
Interest Rate
8.25%
Mortgage Type
Purchase Money Mortgage
Create a Home Valuation Report for This Property
The Home Valuation Report is an in-depth analysis detailing your home's value as well as a comparison with similar homes in the area
Home Values in the Area
Average Home Value in this Area
Purchase History
| Date | Buyer | Sale Price | Title Company |
|---|---|---|---|
| Stinson Johnny | $139,000 | -- | |
| Wood Ave Rt 56 | $72,000 | -- | |
| Foster Mtg Corp | $75,000 | -- |
Source: Public Records
Mortgage History
| Date | Status | Borrower | Loan Amount |
|---|---|---|---|
| Closed | Foster Mtg Corp | $132,050 | |
| Closed | Foster Mtg Corp | $85,000 | |
| Previous Owner | Foster Mtg Corp | $20,000 |
Source: Public Records
Tax History Compared to Growth
Tax History
| Year | Tax Paid | Tax Assessment Tax Assessment Total Assessment is a certain percentage of the fair market value that is determined by local assessors to be the total taxable value of land and additions on the property. | Land | Improvement |
|---|---|---|---|---|
| 2025 | $6,303 | $544,300 | $190,900 | $353,400 |
| 2024 | $6,068 | $556,700 | $186,300 | $370,400 |
| 2023 | $5,536 | $515,500 | $172,500 | $343,000 |
| 2022 | $5,241 | $481,700 | $161,200 | $320,500 |
| 2021 | $4,825 | $452,200 | $155,000 | $297,200 |
| 2020 | $4,341 | $411,100 | $160,700 | $250,400 |
| 2019 | $3,939 | $373,700 | $121,600 | $252,100 |
| 2018 | $3,729 | $355,800 | $121,600 | $234,200 |
| 2017 | $3,459 | $326,600 | $121,600 | $205,000 |
| 2016 | $3,389 | $308,100 | $121,600 | $186,500 |
| 2015 | $3,095 | $255,600 | $88,800 | $166,800 |
| 2014 | $2,973 | $236,300 | $88,800 | $147,500 |
Source: Public Records
Map
Nearby Homes
- 58 Mattapan St
- 45 1st Ave Unit 111
- 49 Fottler Rd
- 10 Itasca St
- 710 Walk Hill St
- 12 Hiawatha Rd
- 116 Almont St
- 23 Fessenden St
- 25 Fessenden St
- 60 and 64 Monterey Ave
- 20 Monterey Ave
- 567B Norfolk St
- 100 Itasca St
- 1465 Blue Hill Ave
- 14-14R Kennebec St
- 4 Gilmer St
- 157 Delhi St
- 10 Hosmer St
- 11 French St
- 4 Crossman St Unit 4
- 56 Mattapan St
- 56 Mattapan St
- 56 Mattapan St
- 56 Mattapan St
- 56 Mattapan St
- 56 Mattapan St Unit 58
- 56 Mattapan St
- 56-56A Mattapan St
- 64 Mattapan St
- 52 Mattapan St
- 52 Mattapan St
- 52 Mattapan St
- 52 Mattapan St
- 52 Mattapan St
- 52 Mattapan St Unit 54
- 52 Mattapan St
- 52 Mattapan St
- 52 Mattapan St Unit 2
- 60 Mattapan St
- 60 Mattapan St