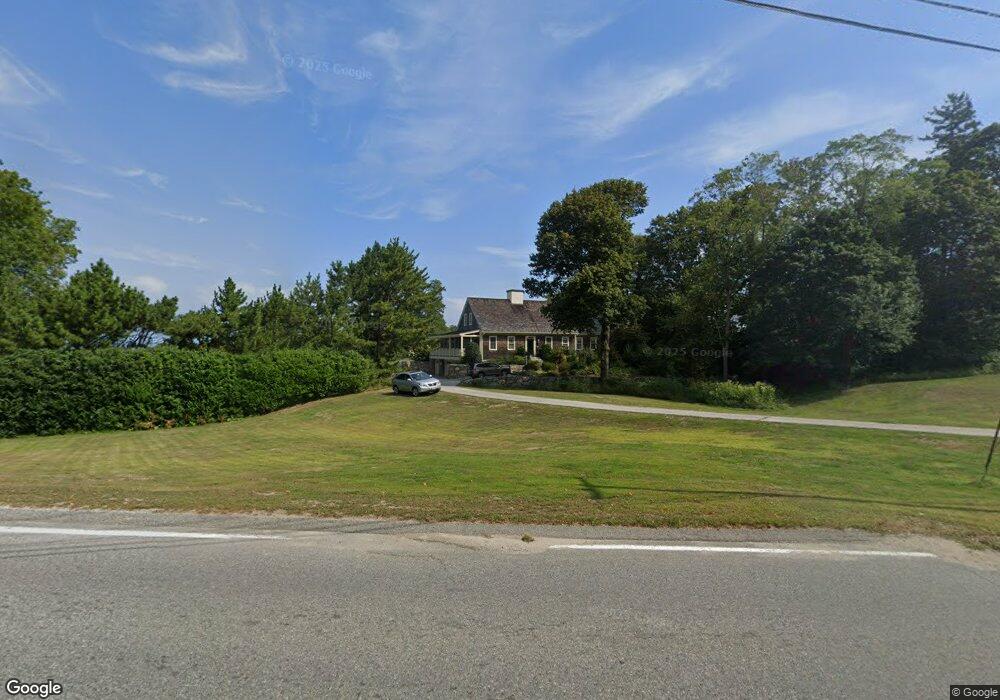
56 N Main St Cohasset, MA 02025
Estimated Value: $2,862,000 - $3,935,000
3
Beds
4
Baths
2,939
Sq Ft
$1,110/Sq Ft
Est. Value
About This Home
This home is located at 56 N Main St, Cohasset, MA 02025 and is currently estimated at $3,261,908, approximately $1,109 per square foot. 56 N Main St is a home located in Norfolk County with nearby schools including Joseph Osgood School, Deer Hill School, and Cohasset Middle School.
Ownership History
Date
Name
Owned For
Owner Type
Purchase Details
Closed on
Dec 10, 2020
Sold by
Goedecke Peter L and Goedecke Jane O
Bought by
Goedecke Jane O
Current Estimated Value
Purchase Details
Closed on
Jan 11, 2018
Sold by
North Main Street Rt and Holt
Bought by
Goedecke Peter L and Goedecke Jane O
Purchase Details
Closed on
Nov 17, 2006
Sold by
Lemmett Holt 3 T and Scholz
Bought by
Holt Elizabeth A
Purchase Details
Closed on
Sep 7, 2001
Sold by
Durant Lindsey H
Bought by
Holt L Emmett L and Holt Elizabeth A
Create a Home Valuation Report for This Property
The Home Valuation Report is an in-depth analysis detailing your home's value as well as a comparison with similar homes in the area
Home Values in the Area
Average Home Value in this Area
Purchase History
| Date | Buyer | Sale Price | Title Company |
|---|---|---|---|
| Goedecke Jane O | -- | None Available | |
| Goedecke Jane O | -- | None Available | |
| Goedecke Jane O | -- | None Available | |
| Goedecke Peter L | $2,900,000 | -- | |
| Goedecke Peter L | $2,900,000 | -- | |
| Holt Elizabeth A | -- | -- | |
| Scholz Carrie H | -- | -- | |
| Holt Elizabeth A | -- | -- | |
| Scholz Carrie H | -- | -- | |
| Holt L Emmett L | $60,000 | -- |
Source: Public Records
Tax History Compared to Growth
Tax History
| Year | Tax Paid | Tax Assessment Tax Assessment Total Assessment is a certain percentage of the fair market value that is determined by local assessors to be the total taxable value of land and additions on the property. | Land | Improvement |
|---|---|---|---|---|
| 2025 | $37,006 | $3,195,700 | $2,417,900 | $777,800 |
| 2024 | $37,164 | $3,053,700 | $2,259,600 | $794,100 |
| 2023 | $35,008 | $2,966,800 | $2,172,700 | $794,100 |
| 2022 | $36,213 | $2,883,200 | $2,172,700 | $710,500 |
| 2021 | $36,962 | $2,834,500 | $2,172,700 | $661,800 |
| 2020 | $35,761 | $2,757,200 | $2,172,700 | $584,500 |
| 2019 | $35,568 | $2,757,200 | $2,172,700 | $584,500 |
| 2018 | $35,265 | $2,757,200 | $2,172,700 | $584,500 |
| 2017 | $32,410 | $2,481,600 | $1,889,500 | $592,100 |
| 2016 | $26,342 | $2,045,200 | $1,453,100 | $592,100 |
| 2015 | $21,746 | $1,710,900 | $1,118,800 | $592,100 |
| 2014 | $21,455 | $1,710,900 | $1,118,800 | $592,100 |
Source: Public Records
Map
Nearby Homes
- 11 Beach St
- 89 Ripley Rd
- 146 N Main St Unit 146
- 25 Ripley Rd
- 18 Pleasant St
- 135 Beach St
- 15 Cushing Rd
- 128 Elm St Unit 211
- 25 Mohawk Way
- 21-23 Elm Ct
- 17 Mohawk Way
- 87 Elm St Unit 215
- 4 Margin St Unit A
- 26 Ash St
- 124 Elm St Unit 202
- 124 Elm St Unit 308
- 56 Margin St
- 119 Pleasant St
- 73 Pond St
- 40 Pond St