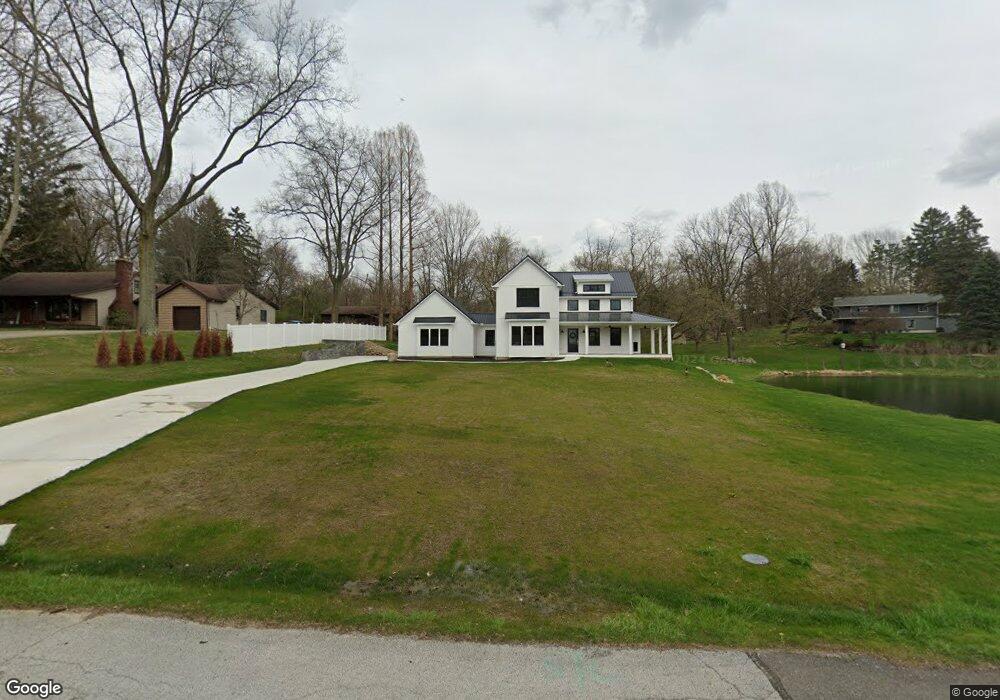
56 N Village View Rd Tallmadge, OH 44278
Estimated Value: $294,000 - $422,024
2
Beds
2
Baths
1,824
Sq Ft
$202/Sq Ft
Est. Value
About This Home
This home is located at 56 N Village View Rd, Tallmadge, OH 44278 and is currently estimated at $368,256, approximately $201 per square foot. 56 N Village View Rd is a home located in Summit County with nearby schools including Tallmadge Middle School, Tallmadge High School, and Steel Academy.
Ownership History
Date
Name
Owned For
Owner Type
Purchase Details
Closed on
Jun 10, 2021
Sold by
Corcoran Amanda M
Bought by
Kristy Antrobius
Current Estimated Value
Purchase Details
Closed on
Nov 30, 2018
Sold by
Corcoran Amanda M and Davis Amanda M
Bought by
Corcoran Amanda M
Home Financials for this Owner
Home Financials are based on the most recent Mortgage that was taken out on this home.
Original Mortgage
$173,600
Interest Rate
4.8%
Mortgage Type
New Conventional
Purchase Details
Closed on
Apr 13, 2017
Sold by
Corcoran Jeremy
Bought by
Corcoran Amanda
Purchase Details
Closed on
Apr 6, 2011
Sold by
Anich Teresa E and Kamps Teresa E
Bought by
Corcoran Jeremy
Home Financials for this Owner
Home Financials are based on the most recent Mortgage that was taken out on this home.
Original Mortgage
$30,000
Interest Rate
4.99%
Mortgage Type
Seller Take Back
Purchase Details
Closed on
Nov 5, 2003
Sold by
Falcone Clara L
Bought by
Kamps Teresa E
Create a Home Valuation Report for This Property
The Home Valuation Report is an in-depth analysis detailing your home's value as well as a comparison with similar homes in the area
Home Values in the Area
Average Home Value in this Area
Purchase History
| Date | Buyer | Sale Price | Title Company |
|---|---|---|---|
| Kristy Antrobius | $60,000 | None Available | |
| Corcoran Amanda M | -- | Nova Title Agency Inc | |
| Corcoran Amanda | -- | None Available | |
| Corcoran Jeremy | $30,000 | None Available | |
| Kamps Teresa E | -- | -- |
Source: Public Records
Mortgage History
| Date | Status | Borrower | Loan Amount |
|---|---|---|---|
| Previous Owner | Corcoran Amanda M | $173,600 | |
| Previous Owner | Corcoran Jeremy | $30,000 |
Source: Public Records
Tax History Compared to Growth
Tax History
| Year | Tax Paid | Tax Assessment Tax Assessment Total Assessment is a certain percentage of the fair market value that is determined by local assessors to be the total taxable value of land and additions on the property. | Land | Improvement |
|---|---|---|---|---|
| 2025 | $506 | $117,377 | $19,499 | $97,878 |
| 2024 | $506 | $117,377 | $19,499 | $97,878 |
| 2023 | $506 | $9,926 | $9,926 | $0 |
| 2022 | $427 | $6,846 | $6,846 | $0 |
| 2021 | $429 | $6,846 | $6,846 | $0 |
| 2020 | $426 | $6,850 | $6,850 | $0 |
| 2019 | $715 | $10,280 | $10,280 | $0 |
| 2018 | $632 | $10,280 | $10,280 | $0 |
| 2017 | $639 | $10,280 | $10,280 | $0 |
| 2016 | $688 | $10,280 | $10,280 | $0 |
| 2015 | $639 | $10,280 | $10,280 | $0 |
| 2014 | $635 | $10,280 | $10,280 | $0 |
| 2013 | $623 | $10,280 | $10,280 | $0 |
Source: Public Records
Map
Nearby Homes
- 185 Reserve Dr
- 313 Southeast Ave
- 353 Southeast Ave
- 213 Green Hill Dr
- 617 Northeast Ave
- 368 Knollwood Ave
- 130 Strecker Dr
- 557 Wring Dr
- 0 East Ave
- 288 S Munroe Rd
- 243 S Munroe Rd
- 532 Beverly Dr
- 0 North Ave Unit 5116540
- 528 Fernwood Ave
- 278 Smith Dr
- 500 Dottie Ct Unit 109
- 159 Waterford Way Unit 44
- 465 Spring Grove Dr
- 617 North Ave
- 206 Fawnwood Dr
- 66 N Village View Rd
- 57 N Village View Rd
- 70 N Village View Rd
- 67 N Village View Rd
- 45 N Village View Rd
- 75 N Village View Rd
- 33 N Village View Rd
- 82 N Village View Rd
- 34 N Village View Rd
- 89 N Village View Rd
- 21 N Village View Rd
- 14 N Village View Rd
- 279 East Ave
- 96 N Village View Rd
- 99 N Village View Rd
- 289 East Ave
- 106 N Village View Rd
- 255 East Ave
- 299 East Ave
- 243 East Ave