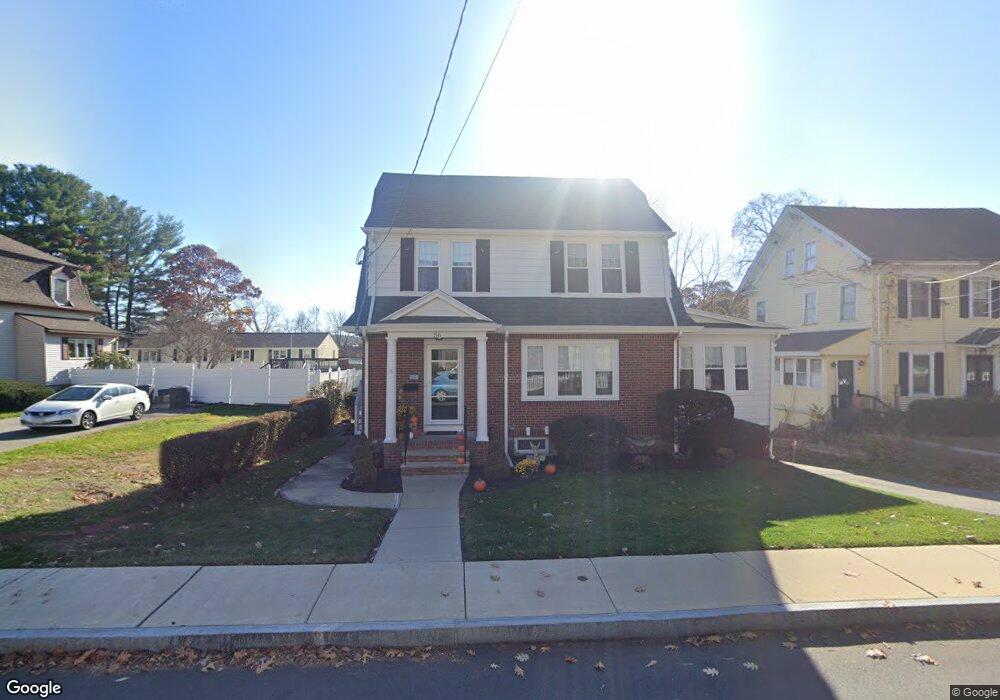
56 Nashua St Woburn, MA 01801
Downtown Woburn NeighborhoodEstimated Value: $740,000 - $904,000
4
Beds
1
Bath
2,250
Sq Ft
$360/Sq Ft
Est. Value
About This Home
This home is located at 56 Nashua St, Woburn, MA 01801 and is currently estimated at $810,744, approximately $360 per square foot. 56 Nashua St is a home located in Middlesex County with nearby schools including Goodyear Elementary School, John F. Kennedy Middle School, and Woburn High School.
Ownership History
Date
Name
Owned For
Owner Type
Purchase Details
Closed on
Oct 24, 2013
Sold by
Mcintyre Barbara A
Bought by
Packard Marc C and Packard Rachelle
Current Estimated Value
Home Financials for this Owner
Home Financials are based on the most recent Mortgage that was taken out on this home.
Original Mortgage
$327,000
Outstanding Balance
$168,437
Interest Rate
4.56%
Mortgage Type
New Conventional
Estimated Equity
$642,307
Create a Home Valuation Report for This Property
The Home Valuation Report is an in-depth analysis detailing your home's value as well as a comparison with similar homes in the area
Home Values in the Area
Average Home Value in this Area
Purchase History
| Date | Buyer | Sale Price | Title Company |
|---|---|---|---|
| Packard Marc C | $385,000 | -- | |
| Packard Marc C | $385,000 | -- |
Source: Public Records
Mortgage History
| Date | Status | Borrower | Loan Amount |
|---|---|---|---|
| Open | Packard Marc C | $327,000 | |
| Closed | Packard Marc C | $327,000 |
Source: Public Records
Tax History Compared to Growth
Tax History
| Year | Tax Paid | Tax Assessment Tax Assessment Total Assessment is a certain percentage of the fair market value that is determined by local assessors to be the total taxable value of land and additions on the property. | Land | Improvement |
|---|---|---|---|---|
| 2025 | $5,282 | $618,500 | $307,500 | $311,000 |
| 2024 | $4,742 | $588,300 | $292,900 | $295,400 |
| 2023 | $4,537 | $521,500 | $266,200 | $255,300 |
| 2022 | $4,394 | $470,400 | $231,500 | $238,900 |
| 2021 | $24,997 | $451,200 | $220,500 | $230,700 |
| 2020 | $4,064 | $436,100 | $220,500 | $215,600 |
| 2019 | $21,062 | $411,100 | $210,000 | $201,100 |
| 2018 | $3,801 | $384,300 | $192,600 | $191,700 |
| 2017 | $17,195 | $355,900 | $183,500 | $172,400 |
| 2016 | $3,373 | $335,600 | $171,500 | $164,100 |
| 2015 | $3,243 | $318,900 | $160,300 | $158,600 |
| 2014 | $3,036 | $290,800 | $147,400 | $143,400 |
Source: Public Records
Map
Nearby Homes
- 3 Frank St
- 3 Laurel St
- 18 Central St
- 18 Carmen Terrace
- 51 Vernon St
- 35 Grape St
- 13 Fremont St Unit 13
- 18 Gardner Ave
- 1 Boline Place
- 19 Mason Way Unit 75
- 2 Mason Way Unit 6524
- 6 Mason Way Unit 6324
- 14 Grant Rd
- 10 Mason Way Unit 61
- 6 Stratton Dr Unit 404
- 6 Stratton Dr Unit 410
- 571 Washington St
- 69 Eastern Ave
- 2 Archer Dr Unit 1
- 62 Jefferson Ave