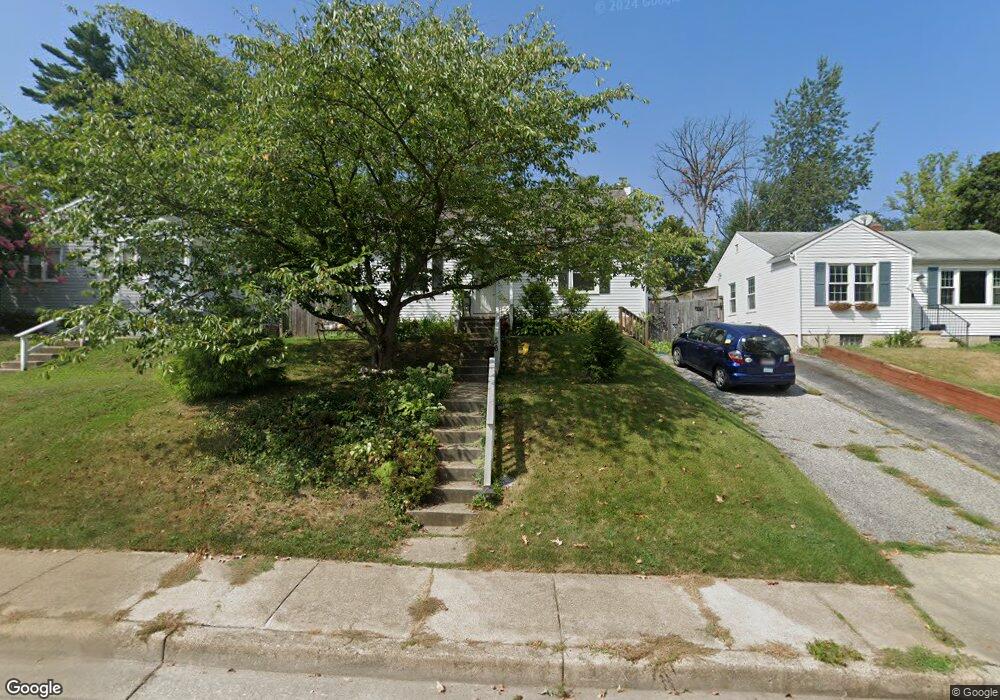
56 Northwood Dr Lutherville Timonium, MD 21093
Estimated Value: $386,379 - $457,000
3
Beds
2
Baths
2,400
Sq Ft
$174/Sq Ft
Est. Value
About This Home
This home is located at 56 Northwood Dr, Lutherville Timonium, MD 21093 and is currently estimated at $417,845, approximately $174 per square foot. 56 Northwood Dr is a home located in Baltimore County with nearby schools including Timonium Elementary School, Ridgely Middle, and Dulaney High School.
Ownership History
Date
Name
Owned For
Owner Type
Purchase Details
Closed on
Jun 1, 2021
Sold by
Rickman Jeannette
Bought by
Rickman Katherine G and Rickman Brian T
Current Estimated Value
Purchase Details
Closed on
Sep 17, 2014
Sold by
Leong Loretta
Bought by
Rickman Jeannette
Purchase Details
Closed on
May 28, 2014
Sold by
Leong Loretta and Cymrot Athena
Bought by
Leong Loretta
Purchase Details
Closed on
Sep 23, 2010
Sold by
Baumgartner Mark R
Bought by
Leong Loretta and Cymrot Athena
Home Financials for this Owner
Home Financials are based on the most recent Mortgage that was taken out on this home.
Original Mortgage
$240,562
Interest Rate
4.44%
Mortgage Type
FHA
Purchase Details
Closed on
Sep 20, 2004
Sold by
Brenner Joel
Bought by
Baumgartner Mark R
Purchase Details
Closed on
Jun 24, 1999
Sold by
Sands Frank L
Bought by
Brenner Joel and Kerr Sarah
Create a Home Valuation Report for This Property
The Home Valuation Report is an in-depth analysis detailing your home's value as well as a comparison with similar homes in the area
Home Values in the Area
Average Home Value in this Area
Purchase History
| Date | Buyer | Sale Price | Title Company |
|---|---|---|---|
| Rickman Katherine G | -- | None Available | |
| Rickman Jeannette | $255,000 | Sage Title Group Llc | |
| Leong Loretta | -- | None Available | |
| Leong Loretta | $245,000 | -- | |
| Baumgartner Mark R | $235,000 | -- | |
| Baumgartner Mark R | $235,000 | -- | |
| Brenner Joel | $130,000 | -- |
Source: Public Records
Mortgage History
| Date | Status | Borrower | Loan Amount |
|---|---|---|---|
| Previous Owner | Leong Loretta | $240,562 |
Source: Public Records
Tax History Compared to Growth
Tax History
| Year | Tax Paid | Tax Assessment Tax Assessment Total Assessment is a certain percentage of the fair market value that is determined by local assessors to be the total taxable value of land and additions on the property. | Land | Improvement |
|---|---|---|---|---|
| 2025 | $4,288 | $326,100 | $120,300 | $205,800 |
| 2024 | $4,288 | $311,900 | $0 | $0 |
| 2023 | $2,044 | $297,700 | $0 | $0 |
| 2022 | $3,873 | $283,500 | $120,300 | $163,200 |
| 2021 | $3,704 | $275,700 | $0 | $0 |
| 2020 | $3,704 | $267,900 | $0 | $0 |
| 2019 | $4,823 | $260,100 | $99,300 | $160,800 |
| 2018 | $3,311 | $245,933 | $0 | $0 |
| 2017 | $3,173 | $231,767 | $0 | $0 |
| 2016 | $3,276 | $217,600 | $0 | $0 |
| 2015 | $3,276 | $217,600 | $0 | $0 |
| 2014 | $3,276 | $217,600 | $0 | $0 |
Source: Public Records
Map
Nearby Homes
- 74 Northwood Dr
- 21 Oakway Rd
- 14 Evans Ave
- 57 Gerard Ave
- 116 Gorsuch Rd
- 27 Edgemoor Rd
- 2111 Eastridge Rd
- 141 Hollow Brook Rd
- 2124 Eastridge Rd
- 114 Country Ln
- 2110 Folkstone Rd
- 2125 Folkstone Rd
- 231 E Timonium Rd
- 2117 Pot Spring Rd
- 17 Deep Dale Dr
- 2212A Pot Spring Rd
- 402 Ivy Church Rd
- 2404 Eastridge Rd
- 903 Morris Ave
- 220 W Timonium Rd