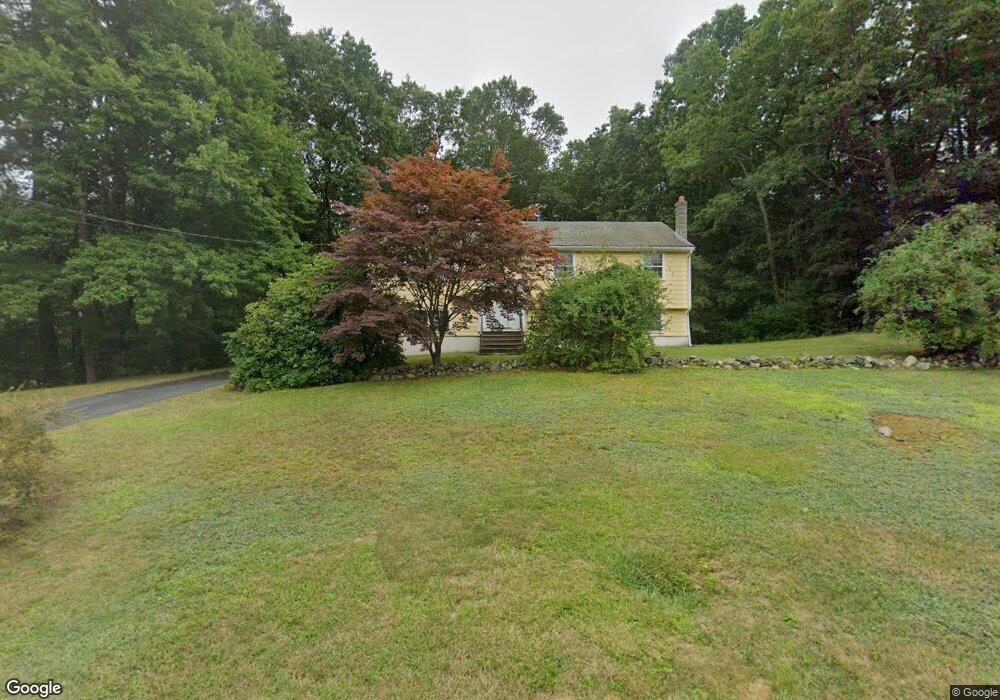
56 Old Farm Rd Hanover, MA 02339
Estimated Value: $530,000 - $753,000
3
Beds
2
Baths
1,152
Sq Ft
$529/Sq Ft
Est. Value
About This Home
This home is located at 56 Old Farm Rd, Hanover, MA 02339 and is currently estimated at $609,827, approximately $529 per square foot. 56 Old Farm Rd is a home located in Plymouth County with nearby schools including Hanover High School and The Master's Academy.
Ownership History
Date
Name
Owned For
Owner Type
Purchase Details
Closed on
Jul 2, 2024
Sold by
Maddock John
Bought by
56 Old Farm Rd Rt and Mcmanus
Current Estimated Value
Purchase Details
Closed on
Sep 21, 2004
Sold by
Maddock Paul F and Maddock Doris A
Bought by
Maddock John
Purchase Details
Closed on
May 25, 1967
Bought by
Maddock John
Create a Home Valuation Report for This Property
The Home Valuation Report is an in-depth analysis detailing your home's value as well as a comparison with similar homes in the area
Home Values in the Area
Average Home Value in this Area
Purchase History
| Date | Buyer | Sale Price | Title Company |
|---|---|---|---|
| 56 Old Farm Rd Rt | -- | None Available | |
| 56 Old Farm Rd Rt | -- | None Available | |
| Maddock John | -- | -- | |
| Maddock John | -- | -- | |
| Maddock John | -- | -- |
Source: Public Records
Mortgage History
| Date | Status | Borrower | Loan Amount |
|---|---|---|---|
| Previous Owner | Maddock John | $10,577 |
Source: Public Records
Tax History Compared to Growth
Tax History
| Year | Tax Paid | Tax Assessment Tax Assessment Total Assessment is a certain percentage of the fair market value that is determined by local assessors to be the total taxable value of land and additions on the property. | Land | Improvement |
|---|---|---|---|---|
| 2025 | $6,686 | $541,400 | $280,700 | $260,700 |
| 2024 | $6,715 | $523,000 | $280,700 | $242,300 |
| 2023 | $6,423 | $476,100 | $255,400 | $220,700 |
| 2022 | $6,681 | $438,100 | $255,400 | $182,700 |
| 2021 | $3,828 | $234,400 | $232,300 | $2,100 |
| 2020 | $6,394 | $392,000 | $232,300 | $159,700 |
| 2019 | $6,062 | $369,400 | $232,300 | $137,100 |
| 2018 | $5,968 | $366,600 | $232,300 | $134,300 |
| 2017 | $5,777 | $349,700 | $216,100 | $133,600 |
| 2016 | $5,565 | $330,100 | $196,500 | $133,600 |
| 2015 | $4,924 | $304,900 | $196,500 | $108,400 |
Source: Public Records
Map
Nearby Homes