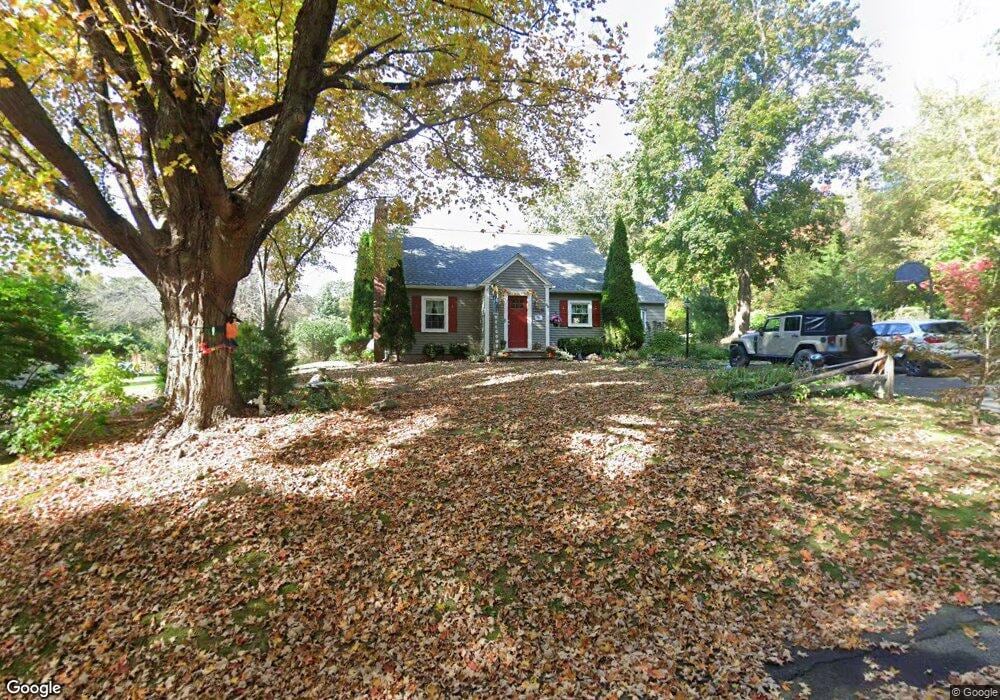
56 Old West High St East Hampton, CT 06424
Estimated Value: $359,000 - $420,000
3
Beds
2
Baths
1,554
Sq Ft
$244/Sq Ft
Est. Value
About This Home
This home is located at 56 Old West High St, East Hampton, CT 06424 and is currently estimated at $379,688, approximately $244 per square foot. 56 Old West High St is a home located in Middlesex County with nearby schools including Memorial School, Center Elementary School, and East Hampton Middle School.
Ownership History
Date
Name
Owned For
Owner Type
Purchase Details
Closed on
Dec 29, 2011
Sold by
Clark Anna R
Bought by
Adams Kirsten J and Adams Bruce C
Current Estimated Value
Purchase Details
Closed on
Oct 30, 1996
Sold by
Brancard Donald W and Truncali Richardk
Bought by
Adams Bruce C and Adams Kirsten J
Create a Home Valuation Report for This Property
The Home Valuation Report is an in-depth analysis detailing your home's value as well as a comparison with similar homes in the area
Home Values in the Area
Average Home Value in this Area
Purchase History
| Date | Buyer | Sale Price | Title Company |
|---|---|---|---|
| Adams Kirsten J | -- | -- | |
| Adams Kirsten J | -- | -- | |
| Adams Bruce C | $118,000 | -- | |
| Adams Bruce C | $118,000 | -- |
Source: Public Records
Mortgage History
| Date | Status | Borrower | Loan Amount |
|---|---|---|---|
| Previous Owner | Adams Bruce C | $60,000 | |
| Previous Owner | Adams Bruce C | $40,000 | |
| Previous Owner | Adams Bruce C | $82,000 |
Source: Public Records
Tax History Compared to Growth
Tax History
| Year | Tax Paid | Tax Assessment Tax Assessment Total Assessment is a certain percentage of the fair market value that is determined by local assessors to be the total taxable value of land and additions on the property. | Land | Improvement |
|---|---|---|---|---|
| 2025 | $5,918 | $149,040 | $40,700 | $108,340 |
| 2024 | $5,669 | $149,040 | $40,700 | $108,340 |
| 2023 | $5,374 | $149,040 | $40,700 | $108,340 |
| 2022 | $5,166 | $149,040 | $40,700 | $108,340 |
| 2021 | $5,146 | $149,040 | $40,700 | $108,340 |
| 2020 | $5,045 | $152,230 | $41,480 | $110,750 |
| 2019 | $5,175 | $156,150 | $42,640 | $113,510 |
| 2018 | $4,891 | $156,150 | $42,640 | $113,510 |
| 2017 | $4,891 | $156,150 | $42,640 | $113,510 |
| 2016 | $4,597 | $156,150 | $42,640 | $113,510 |
| 2015 | $4,107 | $147,830 | $41,040 | $106,790 |
| 2014 | $3,573 | $147,830 | $41,040 | $106,790 |
Source: Public Records
Map
Nearby Homes