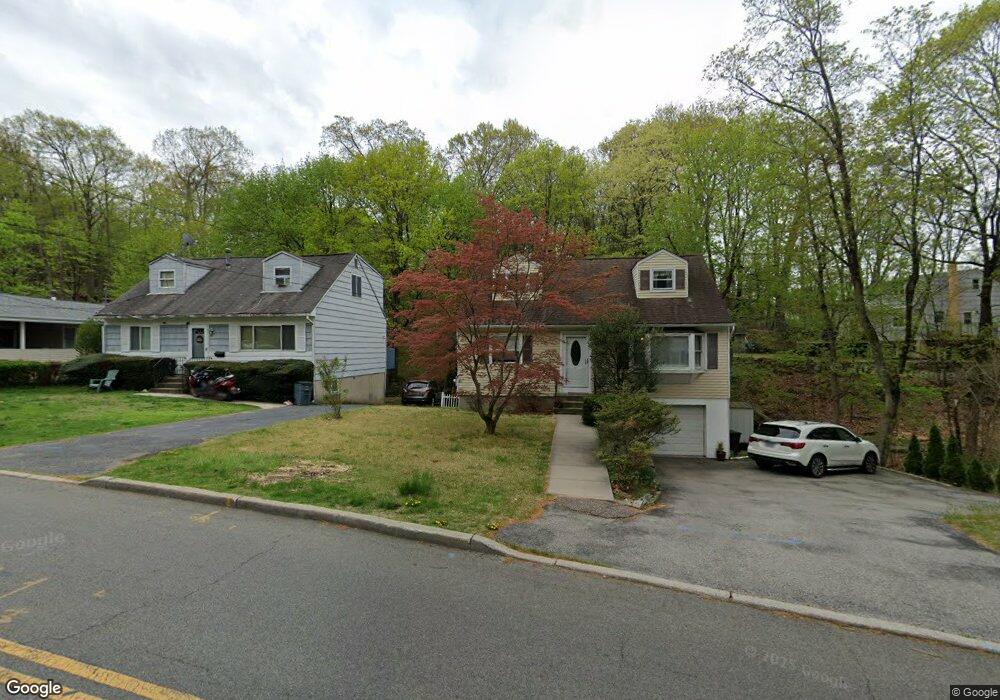
56 Pine Ave Ossining, NY 10562
Estimated Value: $588,171 - $638,000
2
Beds
1
Bath
1,456
Sq Ft
$421/Sq Ft
Est. Value
About This Home
This home is located at 56 Pine Ave, Ossining, NY 10562 and is currently estimated at $613,543, approximately $421 per square foot. 56 Pine Ave is a home located in Westchester County with nearby schools including Park School, Roosevelt Elementary School, and Brookside Elementary School.
Ownership History
Date
Name
Owned For
Owner Type
Purchase Details
Closed on
Sep 30, 2009
Sold by
Petro Lorraine
Bought by
Thurston Holly M and Lisboa William E
Current Estimated Value
Home Financials for this Owner
Home Financials are based on the most recent Mortgage that was taken out on this home.
Original Mortgage
$346,750
Outstanding Balance
$219,666
Interest Rate
5.06%
Mortgage Type
New Conventional
Estimated Equity
$393,877
Create a Home Valuation Report for This Property
The Home Valuation Report is an in-depth analysis detailing your home's value as well as a comparison with similar homes in the area
Home Values in the Area
Average Home Value in this Area
Purchase History
| Date | Buyer | Sale Price | Title Company |
|---|---|---|---|
| Thurston Holly M | $365,000 | Judicial Title |
Source: Public Records
Mortgage History
| Date | Status | Borrower | Loan Amount |
|---|---|---|---|
| Open | Thurston Holly M | $346,750 |
Source: Public Records
Tax History
| Year | Tax Paid | Tax Assessment Tax Assessment Total Assessment is a certain percentage of the fair market value that is determined by local assessors to be the total taxable value of land and additions on the property. | Land | Improvement |
|---|---|---|---|---|
| 2024 | $13,448 | $468,800 | $174,500 | $294,300 |
| 2023 | $12,992 | $441,600 | $174,500 | $267,100 |
| 2022 | $12,650 | $405,400 | $174,500 | $230,900 |
| 2021 | $10,854 | $362,000 | $174,500 | $187,500 |
| 2020 | $11,273 | $362,000 | $174,500 | $187,500 |
| 2019 | $11,121 | $315,600 | $174,500 | $141,100 |
| 2018 | $10,906 | $315,600 | $174,500 | $141,100 |
| 2017 | $1,644 | $309,500 | $174,500 | $135,000 |
| 2016 | $104,858 | $303,400 | $174,500 | $128,900 |
| 2015 | $8,649 | $19,000 | $5,800 | $13,200 |
| 2014 | $8,649 | $19,000 | $5,800 | $13,200 |
| 2013 | $8,649 | $19,000 | $5,800 | $13,200 |
Source: Public Records
Map
Nearby Homes
- 19 Forest Ave
- 10 Pine Brook Rd
- 15 Marshall Place
- 4 Spaulding Place
- 42 Campwoods Grounds
- 7 Hawkes Ave
- 48 Pershing Ave
- 16 Robin St
- 1C Calam Ave
- 41 Croton Dam Rd
- 15 Prospect Ave
- 132 Croton Ave
- 38 Terrace Ave
- 76 Hawkes Ave
- 36 Watson Ave
- 23 Apple Ln
- 59 Watson Ave
- 35 Havell St
- 200 Route 9a
- 42 Brooke View Dr
Your Personal Tour Guide
Ask me questions while you tour the home.