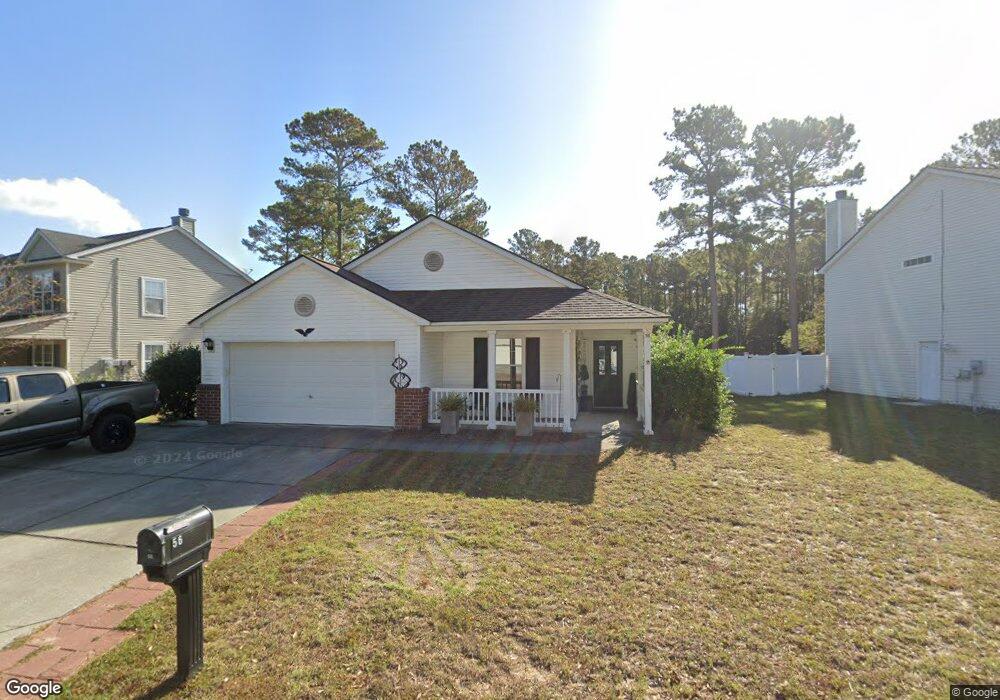
56 Pine Ridge Dr Bluffton, SC 29910
Pine Ridge NeighborhoodEstimated Value: $346,000 - $398,000
3
Beds
2
Baths
1,618
Sq Ft
$231/Sq Ft
Est. Value
About This Home
This home is located at 56 Pine Ridge Dr, Bluffton, SC 29910 and is currently estimated at $374,565, approximately $231 per square foot. 56 Pine Ridge Dr is a home located in Beaufort County with nearby schools including Bluffton Elementary School, H.E. McCracken Middle School, and Bluffton High School.
Ownership History
Date
Name
Owned For
Owner Type
Purchase Details
Closed on
Dec 10, 2014
Sold by
Sweeney Harry Frank and Sulzbach Pamela J
Bought by
Richardson Jeffrey C
Current Estimated Value
Home Financials for this Owner
Home Financials are based on the most recent Mortgage that was taken out on this home.
Original Mortgage
$146,250
Outstanding Balance
$110,779
Interest Rate
4.09%
Mortgage Type
New Conventional
Estimated Equity
$263,786
Purchase Details
Closed on
Mar 5, 2008
Sold by
Hester Pamela M
Bought by
Sweeney Harry Frank and Sulzbach Pamela J
Home Financials for this Owner
Home Financials are based on the most recent Mortgage that was taken out on this home.
Original Mortgage
$157,500
Interest Rate
5.68%
Mortgage Type
Purchase Money Mortgage
Purchase Details
Closed on
Oct 14, 2004
Sold by
Centex Homes
Bought by
Hester Pamela M
Home Financials for this Owner
Home Financials are based on the most recent Mortgage that was taken out on this home.
Original Mortgage
$152,620
Interest Rate
5.71%
Mortgage Type
Purchase Money Mortgage
Create a Home Valuation Report for This Property
The Home Valuation Report is an in-depth analysis detailing your home's value as well as a comparison with similar homes in the area
Home Values in the Area
Average Home Value in this Area
Purchase History
| Date | Buyer | Sale Price | Title Company |
|---|---|---|---|
| Richardson Jeffrey C | $162,500 | -- | |
| Sweeney Harry Frank | $175,000 | Attorney | |
| Hester Pamela M | $169,579 | -- |
Source: Public Records
Mortgage History
| Date | Status | Borrower | Loan Amount |
|---|---|---|---|
| Open | Richardson Jeffrey C | $146,250 | |
| Previous Owner | Sweeney Harry Frank | $157,500 | |
| Previous Owner | Hester Pamela M | $152,620 |
Source: Public Records
Tax History
| Year | Tax Paid | Tax Assessment Tax Assessment Total Assessment is a certain percentage of the fair market value that is determined by local assessors to be the total taxable value of land and additions on the property. | Land | Improvement |
|---|---|---|---|---|
| 2025 | $1,497 | $8,600 | $0 | $0 |
| 2024 | $1,497 | $13,740 | $4,000 | $9,740 |
| 2023 | $1,498 | $13,740 | $4,000 | $9,740 |
| 2022 | $1,388 | $8,056 | $1,600 | $6,456 |
| 2021 | $1,377 | $8,056 | $1,600 | $6,456 |
| 2020 | $1,372 | $8,056 | $1,600 | $6,456 |
| 2019 | $1,328 | $8,056 | $1,600 | $6,456 |
| 2018 | $1,304 | $7,480 | $0 | $0 |
| 2017 | $1,166 | $6,500 | $0 | $0 |
| 2016 | $1,165 | $6,500 | $0 | $0 |
| 2014 | $3,206 | $7,490 | $0 | $0 |
Source: Public Records
Map
Nearby Homes
- 11 Longleaf Ct
- 37 Heather Glenn Ln
- 18 Torrey Ln
- 363 Gardners Cir
- 3 Wiregrass Way
- 9 Boxtail Crescent
- 287 Old Bridge Dr
- 317 Hill Pond Rd
- 35 Wheatfield Cir
- 328 Hill Pond Rd
- 323 Mill Pond Rd
- 363 Hill Pond Rd
- 353 Hill Pond Rd
- 83 Wheatfield Cir
- 843 Rocking Horse Ln
- 1007 May River Rd
- 45 Linden Park Dr
- 942 May River Rd
- 169 Pinecrest Dr
- 163 Pinecrest Dr
- 54 Pine Ridge Dr
- 60 Pine Ridge Dr
- 52 Pine Ridge Dr
- 63 Pine Ridge Dr
- 61 Pine Ridge Dr
- 59 Pine Ridge Dr
- 62 Pine Ridge Dr
- 57 Pine Ridge Dr
- 50 Pine Ridge Dr
- 65 Pine Ridge Dr
- 55 Pine Ridge Dr
- 8 Long Leaf Ct
- 64 Pine Ridge Dr
- 48 Pine Ridge Dr
- 53 Pine Ridge Dr
- 6 Long Leaf Ct
- 6 Longleaf Ct
- 3 Heather Glenn Ln
- 67 Pine Ridge Dr
- 51 Pine Ridge Dr
Your Personal Tour Guide
Ask me questions while you tour the home.