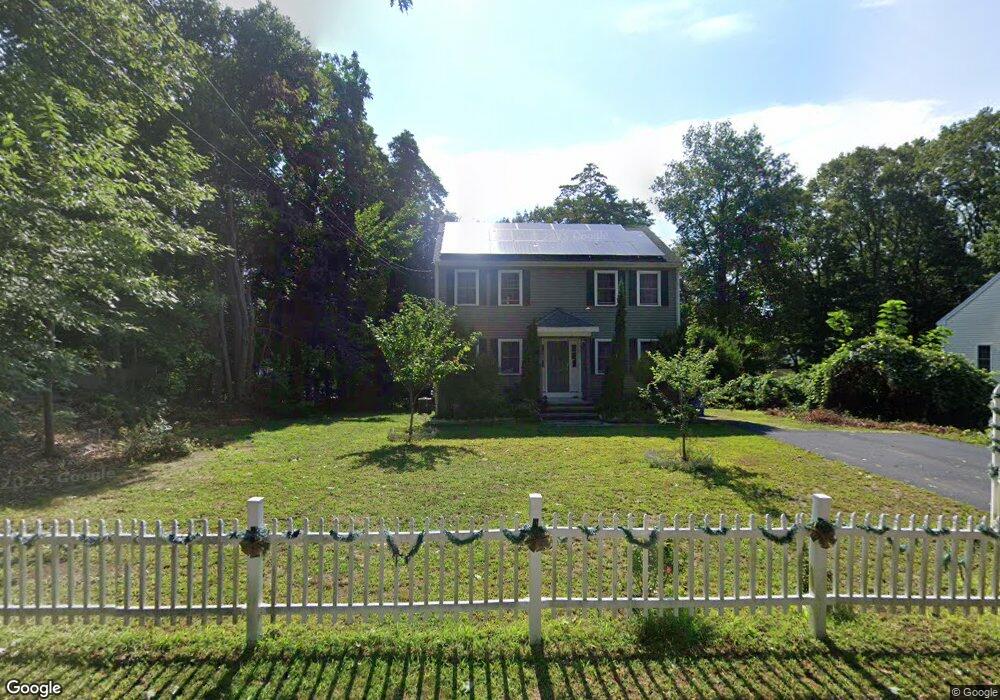
56 Plain St Randolph, MA 02368
Downtown Randolph NeighborhoodEstimated Value: $628,000 - $750,000
3
Beds
2
Baths
1,664
Sq Ft
$406/Sq Ft
Est. Value
About This Home
This home is located at 56 Plain St, Randolph, MA 02368 and is currently estimated at $674,911, approximately $405 per square foot. 56 Plain St is a home located in Norfolk County with nearby schools including Randolph High School, Boston Higashi School, and Lighthouse Baptist Christian Academy.
Ownership History
Date
Name
Owned For
Owner Type
Purchase Details
Closed on
Dec 31, 2013
Sold by
Liberty Realty Dev Inc
Bought by
Kuprasithrut Wasana
Current Estimated Value
Home Financials for this Owner
Home Financials are based on the most recent Mortgage that was taken out on this home.
Original Mortgage
$205,684
Outstanding Balance
$152,715
Interest Rate
4.35%
Mortgage Type
New Conventional
Estimated Equity
$522,196
Purchase Details
Closed on
Jan 2, 2013
Sold by
Ginnetty David
Bought by
Liberty Realty Dev Inc
Create a Home Valuation Report for This Property
The Home Valuation Report is an in-depth analysis detailing your home's value as well as a comparison with similar homes in the area
Home Values in the Area
Average Home Value in this Area
Purchase History
| Date | Buyer | Sale Price | Title Company |
|---|---|---|---|
| Kuprasithrut Wasana | $342,808 | -- | |
| Kuprasithrut Wasana | $342,808 | -- | |
| Liberty Realty Dev Inc | $75,000 | -- |
Source: Public Records
Mortgage History
| Date | Status | Borrower | Loan Amount |
|---|---|---|---|
| Open | Kuprasithrut Wasana | $205,684 | |
| Closed | Kuprasithrut Wasana | $205,684 |
Source: Public Records
Tax History
| Year | Tax Paid | Tax Assessment Tax Assessment Total Assessment is a certain percentage of the fair market value that is determined by local assessors to be the total taxable value of land and additions on the property. | Land | Improvement |
|---|---|---|---|---|
| 2025 | $6,643 | $572,200 | $234,100 | $338,100 |
| 2024 | $6,346 | $554,200 | $229,500 | $324,700 |
| 2023 | $6,364 | $526,800 | $208,800 | $318,000 |
| 2022 | $5,875 | $432,000 | $174,000 | $258,000 |
| 2021 | $5,647 | $382,100 | $144,900 | $237,200 |
| 2020 | $5,588 | $374,800 | $144,900 | $229,900 |
| 2019 | $5,300 | $353,800 | $138,000 | $215,800 |
| 2018 | $5,350 | $336,900 | $125,500 | $211,400 |
| 2017 | $5,449 | $336,800 | $119,600 | $217,200 |
| 2016 | $5,387 | $309,800 | $108,600 | $201,200 |
| 2015 | $5,187 | $286,600 | $103,600 | $183,000 |
Source: Public Records
Map
Nearby Homes
- 10 Alfred Terrace
- 6 Eagle Rd
- 158 Union St
- 217 Mill St
- 229 Mill St
- 249 Mill St
- 7 Van Beal Rd
- 23 Nightingale Cir
- 28 Mcdonnell Dr
- 327 Union St
- 33 Hemlock Terrace
- 43 West St Unit A2
- 20 Isabelle Ave
- 54 Highland Glen Dr
- 59 Highland Glen Dr Unit 328
- 159 Bittersweet Ln Unit 107
- 5 Patterson Ave E
- 153 West St
- 120 Roberts Ave
- 276 Center St
Your Personal Tour Guide
Ask me questions while you tour the home.