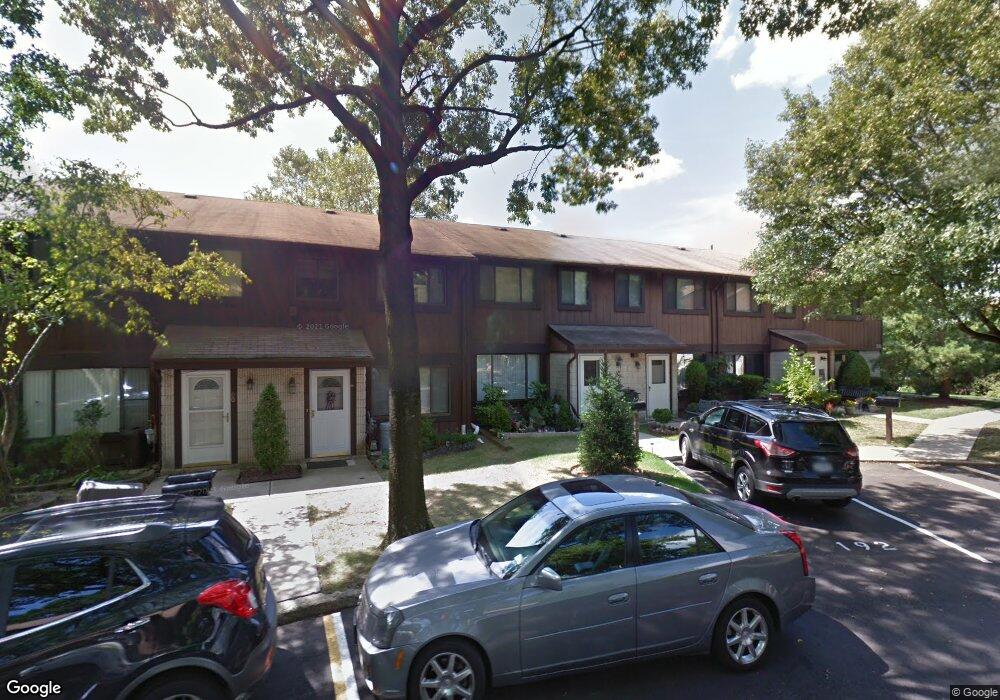
56 Rumson Rd Unit 9E Staten Island, NY 10314
New Springville NeighborhoodEstimated Value: $522,596 - $591,000
3
Beds
2
Baths
1,242
Sq Ft
$450/Sq Ft
Est. Value
About This Home
This home is located at 56 Rumson Rd Unit 9E, Staten Island, NY 10314 and is currently estimated at $558,399, approximately $449 per square foot. 56 Rumson Rd Unit 9E is a home located in Richmond County with nearby schools including P.S. 58R Space Shuttle Columbia School, Is 72 Rocco Laurie, and Port Richmond High School.
Ownership History
Date
Name
Owned For
Owner Type
Purchase Details
Closed on
Oct 29, 2008
Sold by
Marino Anthony and Marino Margherita
Bought by
Ferraro Michael A and Ferraro Kim M
Current Estimated Value
Home Financials for this Owner
Home Financials are based on the most recent Mortgage that was taken out on this home.
Original Mortgage
$297,000
Outstanding Balance
$195,439
Interest Rate
6.13%
Mortgage Type
Purchase Money Mortgage
Estimated Equity
$362,960
Purchase Details
Closed on
Feb 28, 2003
Sold by
Pizzarelli Audrey Mishik
Bought by
Marino Anthony and Marino Margherita
Home Financials for this Owner
Home Financials are based on the most recent Mortgage that was taken out on this home.
Original Mortgage
$199,000
Interest Rate
5.93%
Mortgage Type
Purchase Money Mortgage
Create a Home Valuation Report for This Property
The Home Valuation Report is an in-depth analysis detailing your home's value as well as a comparison with similar homes in the area
Home Values in the Area
Average Home Value in this Area
Purchase History
| Date | Buyer | Sale Price | Title Company |
|---|---|---|---|
| Ferraro Michael A | $330,000 | None Available | |
| Marino Anthony | $210,000 | Fidelity National Title Ins |
Source: Public Records
Mortgage History
| Date | Status | Borrower | Loan Amount |
|---|---|---|---|
| Open | Ferraro Michael A | $297,000 | |
| Previous Owner | Marino Anthony | $199,000 |
Source: Public Records
Tax History
| Year | Tax Paid | Tax Assessment Tax Assessment Total Assessment is a certain percentage of the fair market value that is determined by local assessors to be the total taxable value of land and additions on the property. | Land | Improvement |
|---|---|---|---|---|
| 2025 | $3,266 | $26,482 | $1,462 | $25,020 |
| 2024 | $3,266 | $25,834 | $1,487 | $24,347 |
| 2023 | $3,115 | $15,340 | $1,355 | $13,985 |
| 2022 | $2,889 | $21,371 | $2,363 | $19,008 |
| 2021 | $2,873 | $21,371 | $2,363 | $19,008 |
| 2020 | $2,890 | $21,436 | $2,363 | $19,073 |
| 2019 | $2,834 | $21,278 | $2,363 | $18,915 |
| 2018 | $2,606 | $12,783 | $1,470 | $11,313 |
| 2017 | $2,458 | $12,060 | $1,279 | $10,781 |
| 2016 | $2,275 | $11,378 | $1,242 | $10,136 |
| 2015 | $2,167 | $11,378 | $1,235 | $10,143 |
| 2014 | $2,167 | $11,292 | $1,492 | $9,800 |
Source: Public Records
Map
Nearby Homes
- 116 Windham Loop Unit 460
- 363 Windham Loop
- 17 Gregory Ln Unit A
- 15 Amy Ct Unit 143
- 463 Windham Loop
- 11 Windham Loop Unit 2DD
- 5 Windham Loop Unit 7I
- 11 Windham Loop Unit 1NN
- 5 Windham Loop Unit 1E
- 1818 Forest Hill Rd
- 89 Lott Ln
- 171 Wellington Ct Unit 3B
- 85 Elmwood Park Dr Unit 2
- 50 Donna Ct Unit 5
- 160 Devon Loop Unit 5
- 170 Devon Loop Unit 4
- 30 Donna Ct Unit 6
- 120 Devon Loop Unit 6
- 155 Devon Loop Unit A
- 22 A Elmwood Park Dr
- 54 Rumson Rd
- 58 Rumson Rd Unit 8E
- 52 Rumson Rd Unit 11E
- 60 Rumson Rd Unit 7
- 62 Rumson Rd
- 64 Rumson Rd Unit 1/5E
- 66 Rumson Rd Unit 4E
- 48 Rumson Rd Unit 50
- 48 Rumson Rd
- 46 Rumson Rd Unit 2/14B
- 68 Rumson Rd Unit 3E
- 44 Rumson Rd Unit 15B
- 75 Rumson Rd
- 70 Rumson Rd Unit 2E
- 77 Rumson Rd
- 42 Rumson Rd Unit 16
- 72 Rumson Rd
- 73 Rumson Rd Unit 34C
- 59 Rumson Rd
- 79 Rumson Rd
Your Personal Tour Guide
Ask me questions while you tour the home.