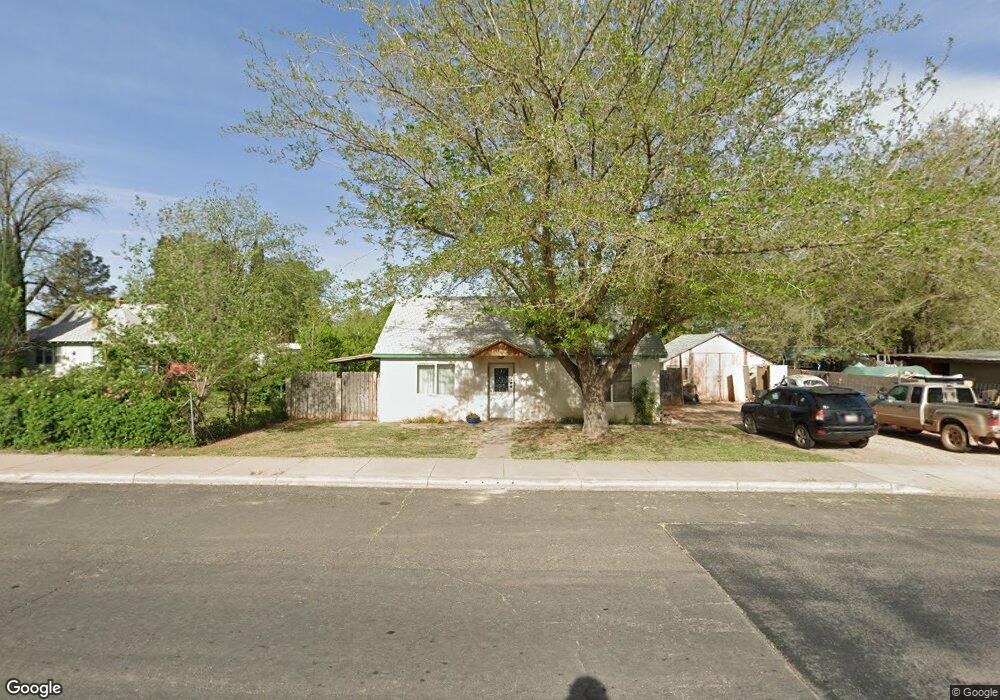
56 S 200 W Hurricane, UT 84737
Estimated Value: $259,000 - $371,000
2
Beds
1
Bath
804
Sq Ft
$371/Sq Ft
Est. Value
About This Home
This home is located at 56 S 200 W, Hurricane, UT 84737 and is currently estimated at $298,004, approximately $370 per square foot. 56 S 200 W is a home located in Washington County with nearby schools including Hurricane High School, Hurricane Middle School, and Three Falls School.
Ownership History
Date
Name
Owned For
Owner Type
Purchase Details
Closed on
Sep 9, 2024
Sold by
Lorigan Debra K
Bought by
Lorigan Debra and Roberts Charity
Current Estimated Value
Home Financials for this Owner
Home Financials are based on the most recent Mortgage that was taken out on this home.
Original Mortgage
$117,500
Outstanding Balance
$115,582
Interest Rate
6.73%
Mortgage Type
New Conventional
Estimated Equity
$182,422
Purchase Details
Closed on
Aug 7, 2023
Sold by
Lorigan Debra Johnson
Bought by
Lorigan Debra K
Purchase Details
Closed on
Feb 14, 2022
Sold by
Johnson Scott and Johnson Debra
Bought by
Loriqan Debra
Purchase Details
Closed on
Sep 1, 2005
Sold by
Johnson Debra K and Johnson Scott Foster
Bought by
Johnson Scott and Johnson Debra
Home Financials for this Owner
Home Financials are based on the most recent Mortgage that was taken out on this home.
Original Mortgage
$63,000
Interest Rate
5.76%
Mortgage Type
New Conventional
Create a Home Valuation Report for This Property
The Home Valuation Report is an in-depth analysis detailing your home's value as well as a comparison with similar homes in the area
Purchase History
| Date | Buyer | Sale Price | Title Company |
|---|---|---|---|
| Lorigan Debra | -- | Us Title | |
| Lorigan Debra K | -- | Timios | |
| Loriqan Debra | -- | None Listed On Document | |
| Johnson Scott | -- | Terra Title Co |
Source: Public Records
Mortgage History
| Date | Status | Borrower | Loan Amount |
|---|---|---|---|
| Open | Lorigan Debra | $117,500 | |
| Previous Owner | Johnson Scott | $63,000 |
Source: Public Records
Tax History
| Year | Tax Paid | Tax Assessment Tax Assessment Total Assessment is a certain percentage of the fair market value that is determined by local assessors to be the total taxable value of land and additions on the property. | Land | Improvement |
|---|---|---|---|---|
| 2025 | $961 | $131,065 | $65,615 | $65,450 |
| 2023 | $925 | $124,080 | $58,465 | $65,615 |
| 2022 | $1,070 | $134,585 | $36,905 | $97,680 |
| 2021 | $936 | $174,000 | $48,800 | $125,200 |
| 2020 | $757 | $131,600 | $47,400 | $84,200 |
| 2019 | $673 | $113,400 | $41,900 | $71,500 |
| 2018 | $732 | $60,995 | $0 | $0 |
| 2017 | $579 | $48,290 | $0 | $0 |
| 2016 | $598 | $48,290 | $0 | $0 |
| 2015 | $609 | $47,355 | $0 | $0 |
| 2014 | $504 | $40,755 | $0 | $0 |
Source: Public Records
Map
Nearby Homes
Your Personal Tour Guide
Ask me questions while you tour the home.