Estimated Value: $152,988 - $178,000
3
Beds
1
Bath
1,488
Sq Ft
$107/Sq Ft
Est. Value
About This Home
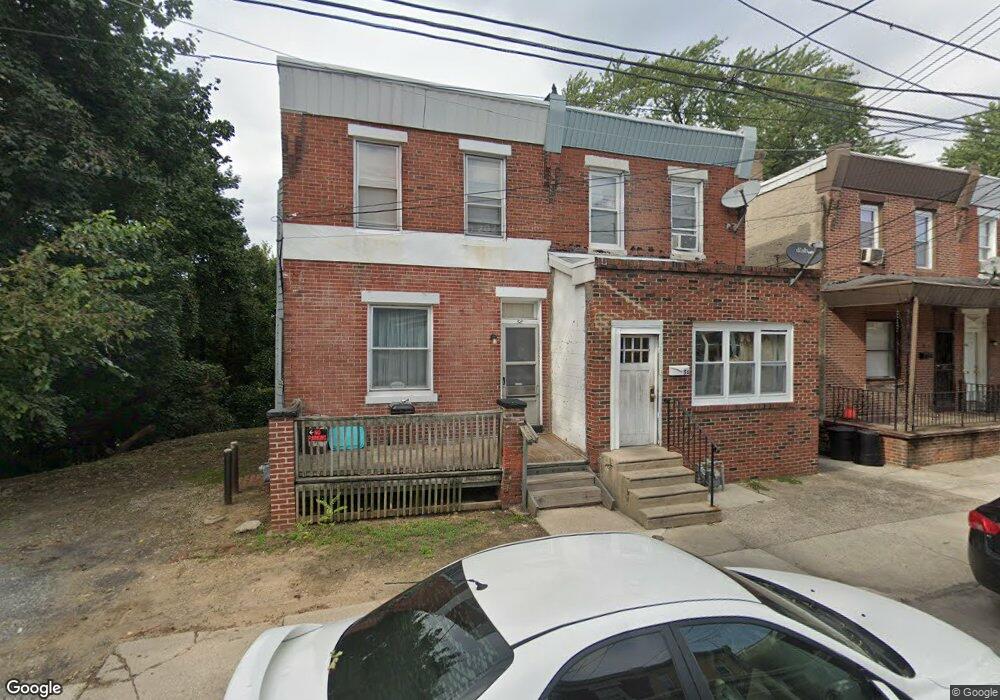
This home is located at 56 S 7th St, Darby, PA 19023 and is currently estimated at $159,747, approximately $107 per square foot. 56 S 7th St is a home located in Delaware County with nearby schools including Walnut Street Elementary School, Penn Wood Middle School, and Penn Wood High School - Cypress Street Campus.
Ownership History
Date
Name
Owned For
Owner Type
Purchase Details
Closed on
Sep 23, 2004
Sold by
Bressi Anthony J
Bought by
Mansaray Alilaji
Current Estimated Value
Home Financials for this Owner
Home Financials are based on the most recent Mortgage that was taken out on this home.
Original Mortgage
$64,390
Outstanding Balance
$31,751
Interest Rate
5.81%
Mortgage Type
FHA
Estimated Equity
$127,996
Purchase Details
Closed on
Mar 3, 1998
Sold by
Payne James and Payne Monica C
Bought by
Homeside Lending Inc
Purchase Details
Closed on
Feb 11, 1998
Sold by
Homeside Lending Inc
Bought by
Hud
Create a Home Valuation Report for This Property
The Home Valuation Report is an in-depth analysis detailing your home's value as well as a comparison with similar homes in the area
Home Values in the Area
Average Home Value in this Area
Purchase History
| Date | Buyer | Sale Price | Title Company |
|---|---|---|---|
| Mansaray Alilaji | $64,900 | -- | |
| Homeside Lending Inc | -- | -- | |
| Hud | -- | -- |
Source: Public Records
Mortgage History
| Date | Status | Borrower | Loan Amount |
|---|---|---|---|
| Open | Mansaray Alilaji | $64,390 |
Source: Public Records
Tax History Compared to Growth
Tax History
| Year | Tax Paid | Tax Assessment Tax Assessment Total Assessment is a certain percentage of the fair market value that is determined by local assessors to be the total taxable value of land and additions on the property. | Land | Improvement |
|---|---|---|---|---|
| 2025 | $3,191 | $64,450 | $20,270 | $44,180 |
| 2024 | $3,191 | $64,450 | $20,270 | $44,180 |
| 2023 | $3,003 | $64,450 | $20,270 | $44,180 |
| 2022 | $2,921 | $64,450 | $20,270 | $44,180 |
| 2021 | $4,076 | $64,450 | $20,270 | $44,180 |
| 2020 | $3,368 | $46,110 | $12,730 | $33,380 |
| 2019 | $3,226 | $46,110 | $12,730 | $33,380 |
| 2018 | $3,186 | $46,110 | $0 | $0 |
| 2017 | $3,128 | $46,110 | $0 | $0 |
| 2016 | $253 | $46,110 | $0 | $0 |
| 2015 | $253 | $46,110 | $0 | $0 |
| 2014 | $253 | $46,110 | $0 | $0 |
Source: Public Records
Map
Nearby Homes