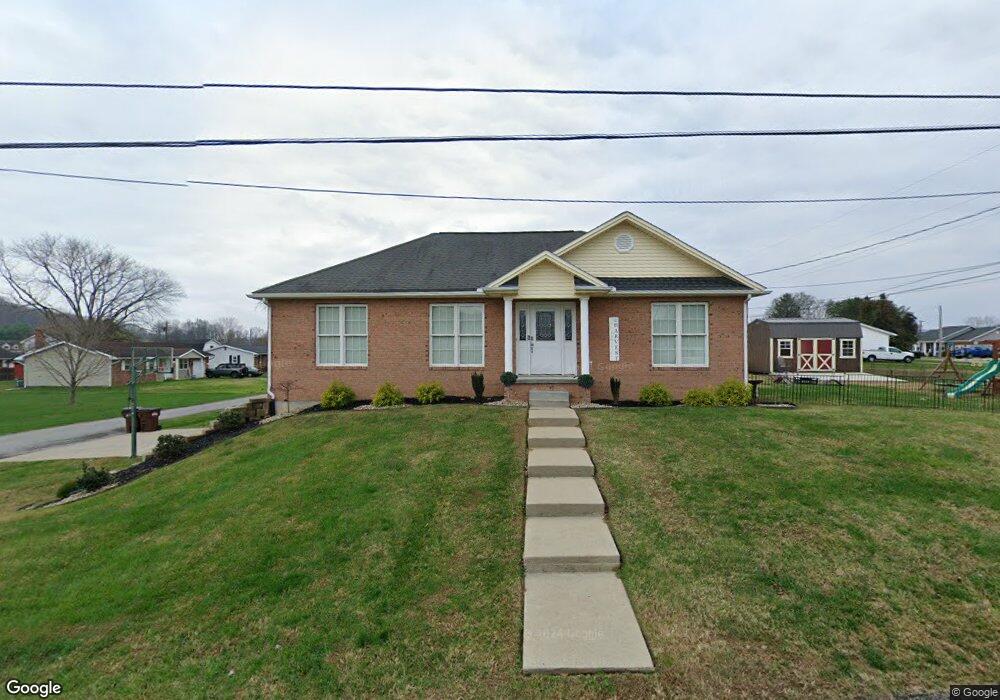
56 Seventh St South Shore, KY 41175
Estimated Value: $131,000 - $221,828
3
Beds
3
Baths
1,344
Sq Ft
$131/Sq Ft
Est. Value
About This Home
This home is located at 56 Seventh St, South Shore, KY 41175 and is currently estimated at $176,457, approximately $131 per square foot. 56 Seventh St is a home located in Greenup County with nearby schools including Greenup County High School.
Ownership History
Date
Name
Owned For
Owner Type
Purchase Details
Closed on
Aug 24, 2021
Sold by
Alger Holbrook Nathan and Alger Heather
Bought by
Holbrook Kathy A
Current Estimated Value
Purchase Details
Closed on
May 26, 2010
Sold by
Parker Randall A and Parker Kathy J
Bought by
Holbrook Jamie D and Melissa Holbrook N
Home Financials for this Owner
Home Financials are based on the most recent Mortgage that was taken out on this home.
Original Mortgage
$90,000
Interest Rate
5%
Create a Home Valuation Report for This Property
The Home Valuation Report is an in-depth analysis detailing your home's value as well as a comparison with similar homes in the area
Home Values in the Area
Average Home Value in this Area
Purchase History
| Date | Buyer | Sale Price | Title Company |
|---|---|---|---|
| Holbrook Kathy A | -- | None Listed On Document | |
| Holbrook Jamie D | $150,000 | -- |
Source: Public Records
Mortgage History
| Date | Status | Borrower | Loan Amount |
|---|---|---|---|
| Previous Owner | Holbrook Jamie D | $90,000 |
Source: Public Records
Tax History Compared to Growth
Tax History
| Year | Tax Paid | Tax Assessment Tax Assessment Total Assessment is a certain percentage of the fair market value that is determined by local assessors to be the total taxable value of land and additions on the property. | Land | Improvement |
|---|---|---|---|---|
| 2025 | $1,719 | $150,000 | $16,500 | $133,500 |
| 2024 | $1,763 | $150,000 | $16,500 | $133,500 |
| 2023 | $1,664 | $150,000 | $16,500 | $133,500 |
| 2022 | $1,704 | $150,000 | $16,500 | $133,500 |
| 2021 | $1,696 | $150,000 | $16,500 | $133,500 |
| 2020 | $1,688 | $150,000 | $16,500 | $133,500 |
| 2019 | $1,703 | $150,000 | $16,500 | $133,500 |
| 2018 | $1,771 | $150,000 | $16,500 | $133,500 |
| 2017 | $1,715 | $150,000 | $16,500 | $133,500 |
| 2016 | $1,715 | $150,000 | $16,500 | $133,500 |
| 2015 | $1,702 | $150,000 | $16,500 | $133,500 |
| 2014 | $1,701 | $150,000 | $16,500 | $133,500 |
| 2011 | -- | $150,000 | $16,500 | $133,500 |
Source: Public Records
Map
Nearby Homes