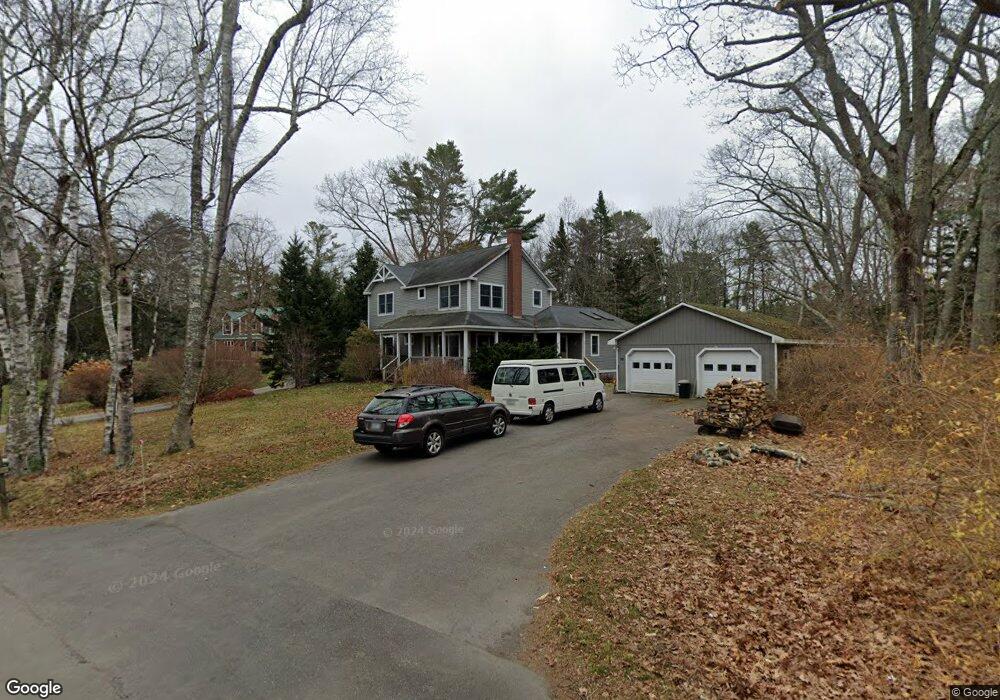
56 Shore Dr Freeport, ME 04032
Estimated Value: $917,000 - $1,111,000
4
Beds
3
Baths
2,318
Sq Ft
$437/Sq Ft
Est. Value
About This Home
This home is located at 56 Shore Dr, Freeport, ME 04032 and is currently estimated at $1,012,699, approximately $436 per square foot. 56 Shore Dr is a home located in Cumberland County with nearby schools including Morse Street School, Mast Landing School, and Freeport Middle School.
Ownership History
Date
Name
Owned For
Owner Type
Purchase Details
Closed on
Aug 10, 2023
Sold by
Carlon David B and Davidson Jennifer M
Bought by
Davidson and Davidson Carlon T
Current Estimated Value
Purchase Details
Closed on
Jun 17, 2014
Sold by
Mcmorrow John B
Bought by
Carlon David B and Davidson Jennifer M
Home Financials for this Owner
Home Financials are based on the most recent Mortgage that was taken out on this home.
Original Mortgage
$302,500
Interest Rate
4.27%
Mortgage Type
New Conventional
Purchase Details
Closed on
Jun 11, 2013
Sold by
Coskery Janie L
Bought by
Mcmorrow J B
Purchase Details
Closed on
Jun 22, 2007
Sold by
Bell-Mcmorrow Carol J
Bought by
Mcmorrow John B
Create a Home Valuation Report for This Property
The Home Valuation Report is an in-depth analysis detailing your home's value as well as a comparison with similar homes in the area
Home Values in the Area
Average Home Value in this Area
Purchase History
| Date | Buyer | Sale Price | Title Company |
|---|---|---|---|
| Davidson | -- | None Available | |
| Davidson | -- | None Available | |
| Carlon David B | -- | -- | |
| Carlon David B | -- | -- | |
| Carlon David B | -- | -- | |
| Mcmorrow J B | -- | -- | |
| Mcmorrow J B | -- | -- | |
| Mcmorrow J B | -- | -- | |
| Mcmorrow John B | -- | -- | |
| Mcmorrow John B | -- | -- |
Source: Public Records
Mortgage History
| Date | Status | Borrower | Loan Amount |
|---|---|---|---|
| Previous Owner | Carlon David B | $302,500 | |
| Previous Owner | Mcmorrow John B | $50,000 |
Source: Public Records
Tax History
| Year | Tax Paid | Tax Assessment Tax Assessment Total Assessment is a certain percentage of the fair market value that is determined by local assessors to be the total taxable value of land and additions on the property. | Land | Improvement |
|---|---|---|---|---|
| 2025 | $9,322 | $673,100 | $273,500 | $399,600 |
| 2024 | $8,812 | $660,100 | $260,500 | $399,600 |
| 2023 | $8,264 | $601,000 | $252,200 | $348,800 |
| 2022 | $7,834 | $573,900 | $225,100 | $348,800 |
| 2021 | $7,662 | $573,900 | $225,100 | $348,800 |
| 2020 | $7,511 | $536,500 | $208,500 | $328,000 |
| 2019 | $7,224 | $505,200 | $196,700 | $308,500 |
| 2018 | $6,986 | $464,200 | $175,700 | $288,500 |
| 2017 | $6,690 | $447,500 | $172,300 | $275,200 |
| 2016 | $6,472 | $409,600 | $154,300 | $255,300 |
| 2015 | $6,540 | $389,300 | $146,500 | $242,800 |
| 2014 | $6,151 | $389,300 | $146,500 | $242,800 |
| 2013 | $6,048 | $381,600 | $146,500 | $235,100 |
Source: Public Records
Map
Nearby Homes
- 70 Maquoit Dr
- 71 Merganser Way
- 52 Birch Point Rd
- 83 Central Ave
- 29 S Freeport Rd
- 10 Newfield Rd
- 26 Harvest Ridge Rd Unit 24
- 15 Linwood Rd Unit 15
- 60 Pleasant Hill Rd
- Map 80 Lot 18-0 White Island
- 30 Meadow Ln Unit 8
- 10 Durham Rd
- 42 Durham Rd
- 10 Prout Rd
- 1260 Us Route 1
- 2 Tidal Brook Rd
- 0 Prout Rd
- 1 Mallard Pond Rd
- 1 Wardtown Rd
- Lot 2B Allen Point Rd
- 60 Shore Dr
- 22 Shore Dr
- 14 Shore Dr
- 57 Shore Dr
- 53 Shore Dr
- 49 Shore Dr
- 87 Shore Dr
- 63 Shore Dr
- E21B Bustins Island West Shore Rd
- 252 Lower Flying Point Rd
- 11 Shore Dr
- 28 Shore Dr
- 43 Shore Dr
- 252 Lower Flying Point
- 260 Lower Flying Point Rd
- 15 Shore Dr
- Lot CA W Shore Dr
- C-A W Shore Dr
- 11 Shore Dr
- 75 Shore Dr
Your Personal Tour Guide
Ask me questions while you tour the home.