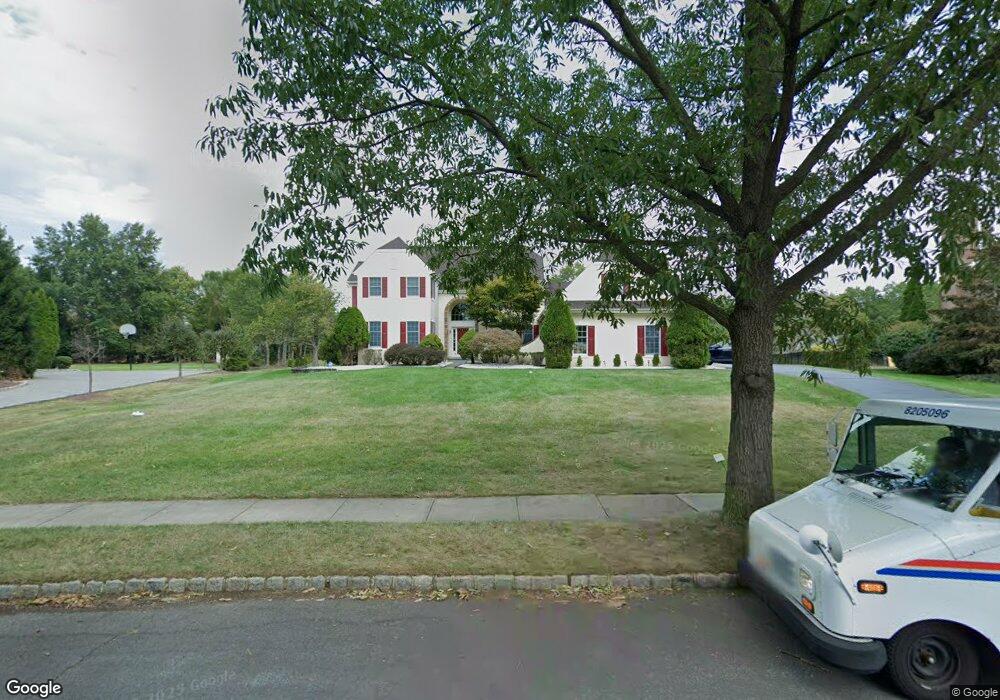
56 Spruce St Princeton Junction, NJ 08550
Estimated Value: $1,420,409 - $1,531,000
5
Beds
4
Baths
3,909
Sq Ft
$376/Sq Ft
Est. Value
About This Home
This home is located at 56 Spruce St, Princeton Junction, NJ 08550 and is currently estimated at $1,470,602, approximately $376 per square foot. 56 Spruce St is a home located in Mercer County with nearby schools including Village Elementary School, Dutch Neck Elementary School, and Community Middle School.
Ownership History
Date
Name
Owned For
Owner Type
Purchase Details
Closed on
Mar 13, 2018
Sold by
Rani Krishna and Rani Lakshmi
Bought by
Vellala Anil Kiran and Kolachana Gayatri
Current Estimated Value
Home Financials for this Owner
Home Financials are based on the most recent Mortgage that was taken out on this home.
Original Mortgage
$676,000
Outstanding Balance
$566,690
Interest Rate
3.5%
Mortgage Type
Adjustable Rate Mortgage/ARM
Estimated Equity
$903,912
Purchase Details
Closed on
Jun 23, 1999
Sold by
Leong Peter
Bought by
Rani Krishna and Sathya Rani
Home Financials for this Owner
Home Financials are based on the most recent Mortgage that was taken out on this home.
Original Mortgage
$373,600
Interest Rate
7.49%
Purchase Details
Closed on
May 31, 1994
Sold by
Calton Homes
Bought by
Leong Peter and Leong Lonie
Home Financials for this Owner
Home Financials are based on the most recent Mortgage that was taken out on this home.
Original Mortgage
$307,000
Interest Rate
8.29%
Create a Home Valuation Report for This Property
The Home Valuation Report is an in-depth analysis detailing your home's value as well as a comparison with similar homes in the area
Home Values in the Area
Average Home Value in this Area
Purchase History
| Date | Buyer | Sale Price | Title Company |
|---|---|---|---|
| Vellala Anil Kiran | $845,000 | Wfg National Title Ins Co | |
| Rani Krishna | $467,000 | -- | |
| Leong Peter | $377,690 | -- |
Source: Public Records
Mortgage History
| Date | Status | Borrower | Loan Amount |
|---|---|---|---|
| Open | Vellala Anil Kiran | $676,000 | |
| Previous Owner | Rani Krishna | $373,600 | |
| Previous Owner | Leong Peter | $307,000 |
Source: Public Records
Tax History Compared to Growth
Tax History
| Year | Tax Paid | Tax Assessment Tax Assessment Total Assessment is a certain percentage of the fair market value that is determined by local assessors to be the total taxable value of land and additions on the property. | Land | Improvement |
|---|---|---|---|---|
| 2025 | $24,351 | $794,500 | $277,200 | $517,300 |
| 2024 | $23,334 | $794,500 | $277,200 | $517,300 |
| 2023 | $23,334 | $794,500 | $277,200 | $517,300 |
| 2022 | $22,882 | $794,500 | $277,200 | $517,300 |
| 2021 | $22,691 | $794,500 | $277,200 | $517,300 |
| 2020 | $22,278 | $794,500 | $277,200 | $517,300 |
| 2019 | $22,024 | $794,500 | $277,200 | $517,300 |
| 2018 | $21,817 | $794,500 | $277,200 | $517,300 |
| 2017 | $21,364 | $794,500 | $277,200 | $517,300 |
| 2016 | $20,903 | $794,500 | $277,200 | $517,300 |
| 2015 | $20,419 | $794,500 | $277,200 | $517,300 |
| 2014 | $20,180 | $794,500 | $277,200 | $517,300 |
Source: Public Records
Map
Nearby Homes