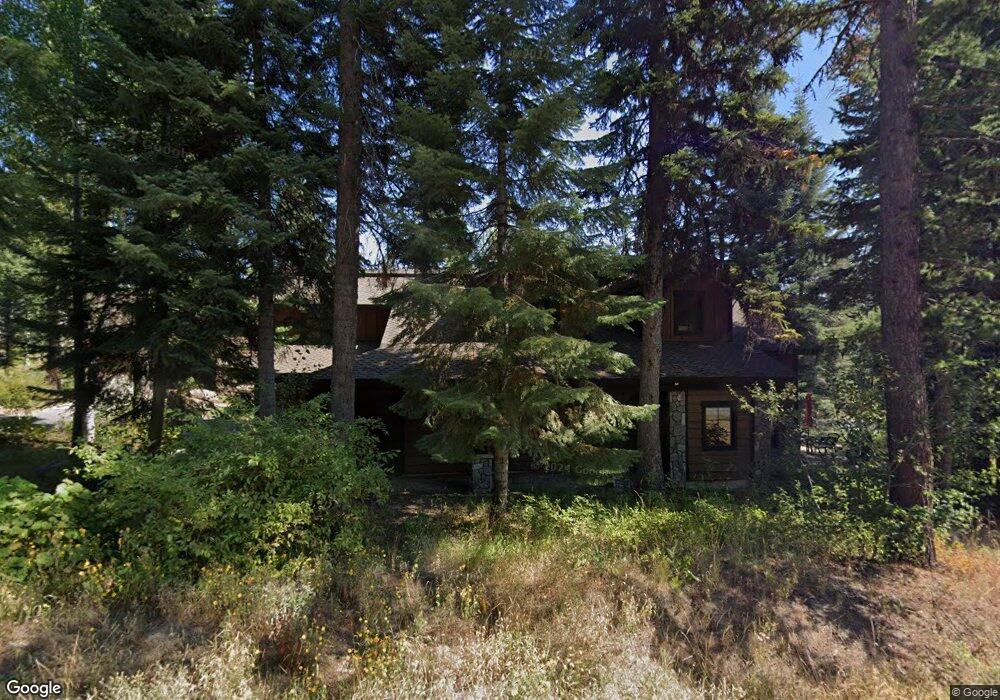
56 Sugarloaf Ct Cascade, ID 83611
Estimated Value: $807,000 - $2,493,000
4
Beds
3
Baths
2,825
Sq Ft
$629/Sq Ft
Est. Value
About This Home
This home is located at 56 Sugarloaf Ct, Cascade, ID 83611 and is currently estimated at $1,778,263, approximately $629 per square foot. 56 Sugarloaf Ct is a home with nearby schools including Donnelly Elementary School and McCall-Donnelly High School.
Ownership History
Date
Name
Owned For
Owner Type
Purchase Details
Closed on
Sep 7, 2021
Sold by
Rota Nicole
Bought by
Sears Trisha
Current Estimated Value
Home Financials for this Owner
Home Financials are based on the most recent Mortgage that was taken out on this home.
Original Mortgage
$219,680
Interest Rate
2.88%
Mortgage Type
New Conventional
Purchase Details
Closed on
May 17, 2016
Sold by
Rota Nicole
Bought by
Rota Nicole and Sears Trisha
Purchase Details
Closed on
Aug 22, 2012
Sold by
Bank Of New York Mello
Bought by
Rota Nicole
Home Financials for this Owner
Home Financials are based on the most recent Mortgage that was taken out on this home.
Original Mortgage
$260,000
Interest Rate
3.37%
Mortgage Type
New Conventional
Purchase Details
Closed on
Oct 31, 2011
Sold by
Mccune Jeffrey D
Bought by
Bank Of New York Mellon and Bank Of New York
Create a Home Valuation Report for This Property
The Home Valuation Report is an in-depth analysis detailing your home's value as well as a comparison with similar homes in the area
Home Values in the Area
Average Home Value in this Area
Purchase History
| Date | Buyer | Sale Price | Title Company |
|---|---|---|---|
| Sears Trisha | -- | None Listed On Document | |
| Rota Nicole | -- | Accommodation | |
| Rota Nicole | -- | Fidelity National Title | |
| Bank Of New York Mellon | $465,000 | -- |
Source: Public Records
Mortgage History
| Date | Status | Borrower | Loan Amount |
|---|---|---|---|
| Previous Owner | Sears Trisha | $219,680 | |
| Previous Owner | Rota Nicole | $260,000 |
Source: Public Records
Tax History Compared to Growth
Tax History
| Year | Tax Paid | Tax Assessment Tax Assessment Total Assessment is a certain percentage of the fair market value that is determined by local assessors to be the total taxable value of land and additions on the property. | Land | Improvement |
|---|---|---|---|---|
| 2025 | $4,595 | $1,962,388 | $450,000 | $1,512,388 |
| 2023 | $4,595 | $1,863,864 | $420,000 | $1,443,864 |
| 2022 | $4,248 | $1,460,214 | $405,000 | $1,055,214 |
| 2021 | $4,611 | $1,055,241 | $175,000 | $880,241 |
| 2020 | $3,974 | $771,627 | $150,000 | $621,627 |
| 2019 | $3,630 | $649,222 | $105,000 | $544,222 |
| 2018 | $3,645 | $622,915 | $79,000 | $543,915 |
| 2017 | $3,444 | $568,483 | $79,000 | $489,483 |
| 2016 | $3,999 | $635,202 | $97,250 | $537,952 |
| 2015 | $4,204 | $635,202 | $0 | $0 |
| 2013 | -- | $596,184 | $0 | $0 |
Source: Public Records
Map
Nearby Homes
- 100 Sugarloaf Place
- 1 Rock Creek Ct
- 141 Sugarloaf Place
- 141 Sugarloaf Place Unit 1
- 9 Rock Creek Ct
- 114 Twin Creek Ct
- Lot 5 Hideout Dr Unit 5
- 700 Village Dr Unit 403
- 740 Village Dr Unit 306
- 700 Village Dr Unit 404
- 131 Twin Creek Ct
- 150 Pinnacle Ct
- 150 Pinnacle Ct Unit 28
- 151 Pinnacle Ct Unit 47
- 151 Pinnacle Ct
- 780 Village Dr Unit 412
- 780 Village Dr Unit 210
- 780 Village Dr Unit 308
- 780 Village Dr Unit 505
- 190 Pinnacle Place
- 58 Sugarloaf Ct
- 90 Sugarloaf
- 90 Sugarloaf Unit 44
- Lot 20 Sugarloaf Place Unit 20
- Lot 20 Sugarloaf Place
- 86 Sugar Loaf Ct
- 90 Sugarloaf Ct
- 88 Sugarloaf Ct
- 88 Sugarloaf Place
- 92 Sugarloaf Place
- 22 Rock Creek Ct
- 96 Sugarloaf Place
- 23 Rock Creek Ct
- 100 Sugarloaf Place
- 21 Rock Creek Ct
- 102 Canoe Ct
- 94 Sugarloaf Ct
- 19 Rock Creek Ct
- Lot 19 Saddle Rock Dr
- 20 Rock Creek Ct