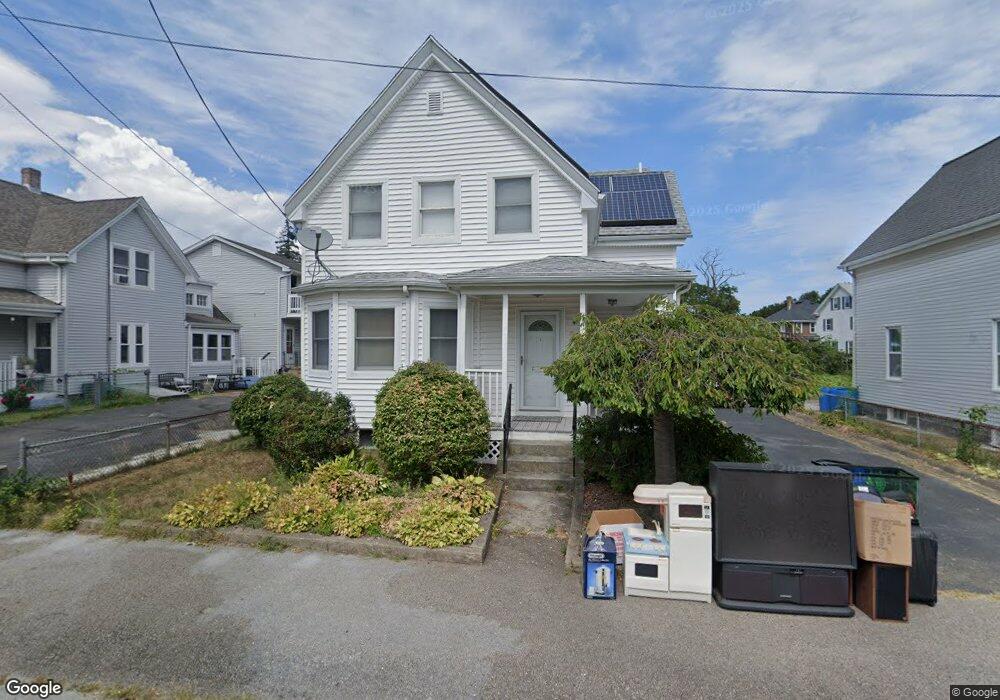
56 Taber St Quincy, MA 02169
South Quincy NeighborhoodEstimated Value: $793,000 - $870,000
4
Beds
2
Baths
2,120
Sq Ft
$392/Sq Ft
Est. Value
About This Home
This home is located at 56 Taber St, Quincy, MA 02169 and is currently estimated at $830,426, approximately $391 per square foot. 56 Taber St is a home located in Norfolk County with nearby schools including South West Middle School, Lincoln-Hancock Community School, and Quincy High School.
Ownership History
Date
Name
Owned For
Owner Type
Purchase Details
Closed on
Oct 22, 2024
Sold by
Chu Helen
Bought by
Helen Chu 2024 Ret and Chu
Current Estimated Value
Purchase Details
Closed on
Jul 8, 1994
Sold by
Cardone Antonio F
Bought by
Chu Helen
Home Financials for this Owner
Home Financials are based on the most recent Mortgage that was taken out on this home.
Original Mortgage
$100,000
Interest Rate
8.51%
Mortgage Type
Purchase Money Mortgage
Create a Home Valuation Report for This Property
The Home Valuation Report is an in-depth analysis detailing your home's value as well as a comparison with similar homes in the area
Home Values in the Area
Average Home Value in this Area
Purchase History
| Date | Buyer | Sale Price | Title Company |
|---|---|---|---|
| Helen Chu 2024 Ret | -- | None Available | |
| Helen Chu 2024 Ret | -- | None Available | |
| Chu Helen | $182,500 | -- | |
| Chu Helen | $182,500 | -- |
Source: Public Records
Mortgage History
| Date | Status | Borrower | Loan Amount |
|---|---|---|---|
| Previous Owner | Chu Helen | $100,000 | |
| Previous Owner | Chu Helen | $70,000 |
Source: Public Records
Tax History Compared to Growth
Tax History
| Year | Tax Paid | Tax Assessment Tax Assessment Total Assessment is a certain percentage of the fair market value that is determined by local assessors to be the total taxable value of land and additions on the property. | Land | Improvement |
|---|---|---|---|---|
| 2025 | $8,072 | $700,100 | $310,300 | $389,800 |
| 2024 | $7,560 | $670,800 | $295,500 | $375,300 |
| 2023 | $6,852 | $615,600 | $268,700 | $346,900 |
| 2022 | $6,933 | $578,700 | $223,900 | $354,800 |
| 2021 | $6,546 | $539,200 | $223,900 | $315,300 |
| 2020 | $6,516 | $524,200 | $223,900 | $300,300 |
| 2019 | $6,358 | $506,600 | $211,300 | $295,300 |
| 2018 | $6,175 | $462,900 | $195,700 | $267,200 |
| 2017 | $6,158 | $434,600 | $186,300 | $248,300 |
| 2016 | $5,623 | $391,600 | $162,100 | $229,500 |
| 2015 | $5,414 | $370,800 | $162,100 | $208,700 |
| 2014 | $5,158 | $347,100 | $162,100 | $185,000 |
Source: Public Records
Map
Nearby Homes
- 56 Penn St Unit 4
- 347 Centre St
- 21 Totman St Unit 202
- 21 Totman St Unit 309
- 21 Totman St Unit Model-1
- 21 Totman St Unit 209
- 21 Totman St Unit 203
- 21 Totman St Unit 2
- 72 Federal Ave
- 118 Brook Rd Unit 2
- 192 Federal Ave Unit B
- 94 Brook Rd Unit 3
- 177 Franklin St
- 8 Jackson St Unit B2
- 50 N Payne St Unit 1
- 50 N Payne St Unit 3
- 51 Brook Rd
- 9 Independence Ave Unit 105
- 9 Independence Ave Unit 307
- 52 Norman Rd
- 60 Taber St
- 50 Taber St
- 22 Trafford St Unit 3
- 22 Trafford St Unit 1
- 22 Trafford St
- 157 Liberty St
- 161 Liberty St
- 161 Liberty St Unit 3
- 161 Liberty St Unit 1
- 161 Liberty St Unit 2
- 151 Liberty St
- 18 Trafford St
- 27 Trafford St Unit 29
- 20 Trafford St Unit 2
- 20 Trafford St Unit 3
- 20 Trafford St
- 147 Liberty St
- 143 Liberty St
- 44 Taber St Unit 2
- 44 Taber St