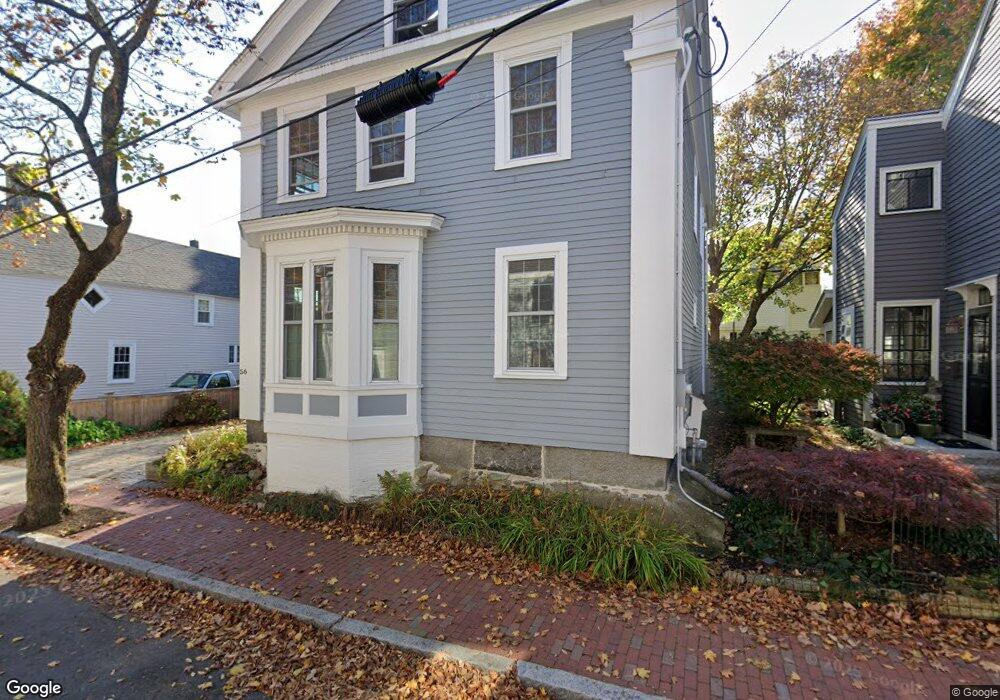
56 Temple St Newburyport, MA 01950
Estimated Value: $1,040,842 - $1,269,000
2
Beds
2
Baths
2,070
Sq Ft
$549/Sq Ft
Est. Value
About This Home
This home is located at 56 Temple St, Newburyport, MA 01950 and is currently estimated at $1,135,614, approximately $548 per square foot. 56 Temple St is a home located in Essex County with nearby schools including Francis T. Bresnahan Elementary School, Edward G. Molin Elementary School, and Rupert A. Nock Middle School.
Ownership History
Date
Name
Owned For
Owner Type
Purchase Details
Closed on
Sep 26, 2019
Sold by
Bagg Mary E
Bought by
Williamson Susan
Current Estimated Value
Purchase Details
Closed on
Oct 14, 2010
Sold by
Bagg Richard A
Bought by
Bagg Richard A and Bagg Mary E
Purchase Details
Closed on
May 22, 2009
Sold by
Olsson Annika
Bought by
Bagg Richard A
Purchase Details
Closed on
May 19, 1999
Sold by
Rowland Adair and Rowland Dean
Bought by
Olsson Annika
Create a Home Valuation Report for This Property
The Home Valuation Report is an in-depth analysis detailing your home's value as well as a comparison with similar homes in the area
Home Values in the Area
Average Home Value in this Area
Purchase History
| Date | Buyer | Sale Price | Title Company |
|---|---|---|---|
| Williamson Susan | $699,900 | -- | |
| Bagg Richard A | -- | -- | |
| Bagg Richard A | $485,000 | -- | |
| Olsson Annika | $268,000 | -- |
Source: Public Records
Mortgage History
| Date | Status | Borrower | Loan Amount |
|---|---|---|---|
| Previous Owner | Olsson Annika | $36,000 | |
| Previous Owner | Olsson Annika | $50,000 | |
| Previous Owner | Olsson Annika | $128,000 |
Source: Public Records
Tax History Compared to Growth
Tax History
| Year | Tax Paid | Tax Assessment Tax Assessment Total Assessment is a certain percentage of the fair market value that is determined by local assessors to be the total taxable value of land and additions on the property. | Land | Improvement |
|---|---|---|---|---|
| 2025 | $8,714 | $909,600 | $403,500 | $506,100 |
| 2024 | $8,345 | $837,000 | $366,800 | $470,200 |
| 2023 | $8,187 | $762,300 | $319,000 | $443,300 |
| 2022 | $7,590 | $632,000 | $265,800 | $366,200 |
| 2021 | $7,226 | $571,700 | $241,600 | $330,100 |
| 2020 | $6,962 | $542,200 | $241,600 | $300,600 |
| 2019 | $7,092 | $542,200 | $241,600 | $300,600 |
| 2018 | $6,796 | $512,500 | $230,100 | $282,400 |
| 2017 | $6,623 | $492,400 | $219,200 | $273,200 |
| 2016 | $6,508 | $486,000 | $199,600 | $286,400 |
| 2015 | $6,483 | $486,000 | $199,600 | $286,400 |
Source: Public Records
Map
Nearby Homes
- 11 Orange St Unit 2
- 42 Federal St Unit B
- 58 Lime St Unit 5
- 11 Charter St
- 57 Lime St Unit 1
- 105 State St Unit 301
- 105 State St Unit 101
- 105 State St Unit 201
- 95 High St Unit 4
- 95 High St Unit 1
- 113 Prospect St Unit B
- 10 10th St
- 30-32 Water St Unit 4
- 164 Water St Unit A
- 166 Water St Unit B
- 2 Court St Unit 4
- 1 Hill St
- 1 Hill St Unit 1
- 58 Merrimac St Unit 2-5
- 17 Madison St
- 58 Temple St
- 52 Temple St Unit 2
- 52 Temple St Unit 54
- 52 Temple St Unit 52
- 54 Temple St
- 54 Temple St
- 54 Temple St Unit 54
- 51 Prospect St
- 51 Prospect St
- 51 Prospect St Unit 51 Prospect Street
- 51 Temple St
- 47 Temple St
- 49 Temple St
- 49 Prospect St
- 49 Prospect St Unit 1
- 66 Federal St
- 70 Federal St Unit 1
- 50 Temple St
- 50 Temple St Unit 1
- 45 Temple St