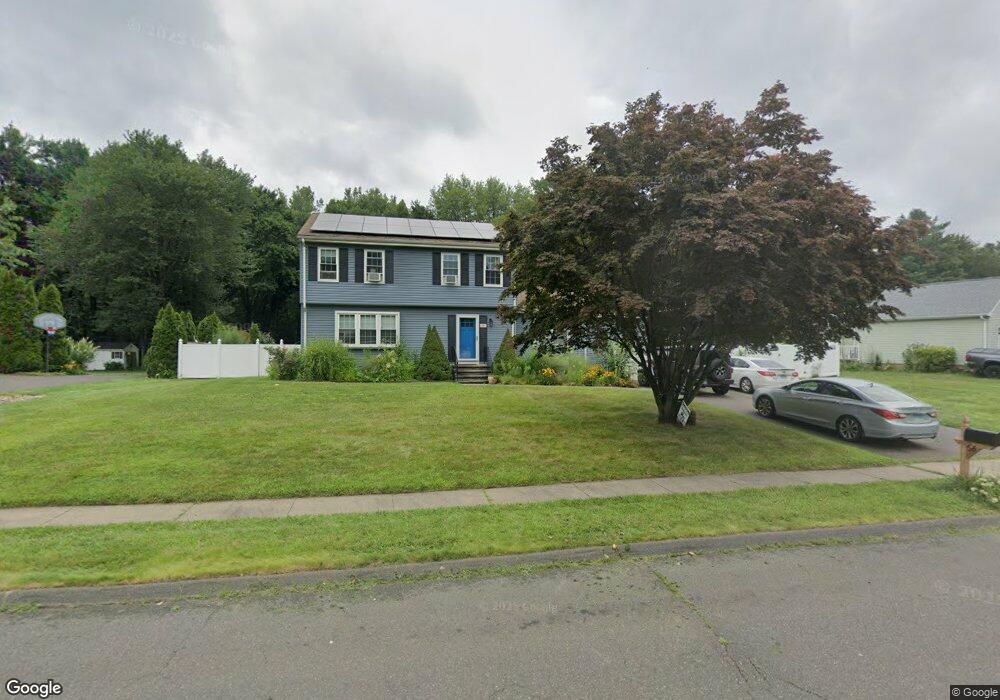
56 Timothy Terrace Windsor, CT 06095
West Windsor NeighborhoodEstimated Value: $435,408 - $453,000
3
Beds
3
Baths
1,926
Sq Ft
$229/Sq Ft
Est. Value
About This Home
This home is located at 56 Timothy Terrace, Windsor, CT 06095 and is currently estimated at $441,102, approximately $229 per square foot. 56 Timothy Terrace is a home located in Hartford County with nearby schools including Poquonock Elementary School, Clover Street School, and Sage Park Middle School.
Ownership History
Date
Name
Owned For
Owner Type
Purchase Details
Closed on
Nov 20, 2023
Sold by
Clarke Naomi
Bought by
Clarke Naomi
Current Estimated Value
Home Financials for this Owner
Home Financials are based on the most recent Mortgage that was taken out on this home.
Original Mortgage
$91,400
Outstanding Balance
$83,280
Interest Rate
6.92%
Mortgage Type
Stand Alone Refi Refinance Of Original Loan
Estimated Equity
$357,822
Purchase Details
Closed on
Feb 1, 2018
Sold by
Puzankov Andrew and Puzankov Olesya
Bought by
Mcneil Naomi
Purchase Details
Closed on
Jul 18, 2005
Sold by
Liang Guoxian and Xing Jing
Bought by
Puzanka Andrew
Purchase Details
Closed on
Aug 13, 2002
Sold by
Jones Richard and Jones Judith
Bought by
Liang Guoxian and Xing Jing
Purchase Details
Closed on
Mar 6, 1989
Sold by
Kuzma Peter
Bought by
Vanschett Judith
Create a Home Valuation Report for This Property
The Home Valuation Report is an in-depth analysis detailing your home's value as well as a comparison with similar homes in the area
Home Values in the Area
Average Home Value in this Area
Purchase History
| Date | Buyer | Sale Price | Title Company |
|---|---|---|---|
| Clarke Naomi | -- | None Available | |
| Clarke Naomi | -- | None Available | |
| Mcneil Naomi | $270,000 | -- | |
| Puzanka Andrew | $290,000 | -- | |
| Liang Guoxian | $245,000 | -- | |
| Mcneil Naomi | $270,000 | -- | |
| Puzanka Andrew | $290,000 | -- | |
| Vanschett Judith | $212,000 | -- |
Source: Public Records
Mortgage History
| Date | Status | Borrower | Loan Amount |
|---|---|---|---|
| Open | Clarke Naomi | $91,400 | |
| Closed | Clarke Naomi | $91,400 | |
| Previous Owner | Vanschett Judith | $50,000 | |
| Previous Owner | Vanschett Judith | $100,000 |
Source: Public Records
Tax History
| Year | Tax Paid | Tax Assessment Tax Assessment Total Assessment is a certain percentage of the fair market value that is determined by local assessors to be the total taxable value of land and additions on the property. | Land | Improvement |
|---|---|---|---|---|
| 2025 | $7,349 | $258,300 | $66,640 | $191,660 |
| 2024 | $7,832 | $258,300 | $66,640 | $191,660 |
| 2023 | $6,002 | $178,640 | $51,800 | $126,840 |
| 2022 | $5,943 | $178,640 | $51,800 | $126,840 |
| 2021 | $5,943 | $178,640 | $51,800 | $126,840 |
| 2020 | $5,915 | $178,640 | $51,800 | $126,840 |
| 2019 | $5,784 | $178,640 | $51,800 | $126,840 |
| 2018 | $5,634 | $170,940 | $51,800 | $119,140 |
| 2017 | $5,547 | $170,940 | $51,800 | $119,140 |
| 2016 | $5,388 | $170,940 | $51,800 | $119,140 |
| 2015 | $5,285 | $170,940 | $51,800 | $119,140 |
| 2014 | $5,209 | $170,940 | $51,800 | $119,140 |
Source: Public Records
Map
Nearby Homes
- 24 Mary Catherine Cir
- 1 Deanne Lynn Cir
- 10 Cleary Ln
- 109 Old Village Cir
- 22 Eastview Dr
- 22 Apple Tree Ln
- 9 Milo Peck Ln
- 1946 Poquonock Ave
- 118 High Path Rd Unit 118
- 136 High Path Rd
- 98 High Path Rd
- 16 Cornfield Rd
- 58 High Path Rd Unit 58
- 943 High Path Rd Unit 943
- 268 High Path Rd Unit 268
- 25 High St
- 490 Old Day Hill Rd
- 11 Concorde Way Unit B2
- 32 Walnut Cir
- 16 Landing Cir
- 52 Timothy Terrace
- 62 Timothy Terrace
- 48 Timothy Terrace
- 66 Timothy Terrace
- 61 Timothy Ter
- 44 Timothy Terrace
- 55 Timothy Terrace
- 70 Timothy Terrace
- 51 Timothy Terrace
- 65 Timothy Terrace
- 40 Timothy Terrace
- 10 Michael Ln
- 71 Timothy Terrace
- 6 Michael Ln
- 41 Timothy Terrace
- 12 Michael Ln
- 74 Timothy Terrace
- 75 Timothy Terrace
- 275 West St
- 39 Timothy Terrace
Your Personal Tour Guide
Ask me questions while you tour the home.