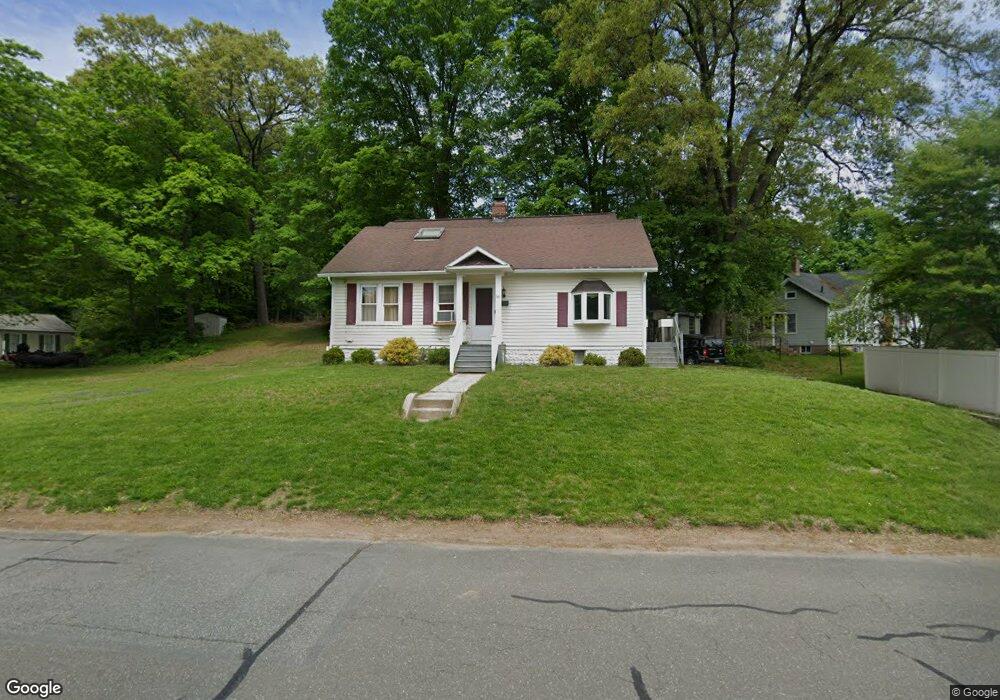
56 Verdugo St West Springfield, MA 01089
Estimated Value: $331,756 - $382,000
4
Beds
2
Baths
1,473
Sq Ft
$246/Sq Ft
Est. Value
About This Home
This home is located at 56 Verdugo St, West Springfield, MA 01089 and is currently estimated at $362,439, approximately $246 per square foot. 56 Verdugo St is a home located in Hampden County with nearby schools including St Thomas The Apostle School.
Ownership History
Date
Name
Owned For
Owner Type
Purchase Details
Closed on
Nov 4, 2024
Sold by
Powers Cathi M and Powers Dennis J
Bought by
Powers Cathi M
Current Estimated Value
Purchase Details
Closed on
May 3, 1997
Sold by
Brown William J and Brown Joan M
Bought by
Morgan Eric M
Home Financials for this Owner
Home Financials are based on the most recent Mortgage that was taken out on this home.
Original Mortgage
$94,700
Interest Rate
7.85%
Mortgage Type
Purchase Money Mortgage
Purchase Details
Closed on
Jun 24, 1988
Sold by
Serra Joseph M
Bought by
Brown William J
Home Financials for this Owner
Home Financials are based on the most recent Mortgage that was taken out on this home.
Original Mortgage
$90,000
Interest Rate
10.32%
Mortgage Type
Purchase Money Mortgage
Create a Home Valuation Report for This Property
The Home Valuation Report is an in-depth analysis detailing your home's value as well as a comparison with similar homes in the area
Home Values in the Area
Average Home Value in this Area
Purchase History
| Date | Buyer | Sale Price | Title Company |
|---|---|---|---|
| Powers Cathi M | -- | None Available | |
| Powers Cathi M | -- | None Available | |
| Morgan Eric M | $97,000 | -- | |
| Morgan Eric M | $97,000 | -- | |
| Brown William J | $112,500 | -- |
Source: Public Records
Mortgage History
| Date | Status | Borrower | Loan Amount |
|---|---|---|---|
| Previous Owner | Brown William J | $94,700 | |
| Previous Owner | Brown William J | $83,000 | |
| Previous Owner | Brown William J | $90,000 |
Source: Public Records
Tax History Compared to Growth
Tax History
| Year | Tax Paid | Tax Assessment Tax Assessment Total Assessment is a certain percentage of the fair market value that is determined by local assessors to be the total taxable value of land and additions on the property. | Land | Improvement |
|---|---|---|---|---|
| 2025 | $4,223 | $284,000 | $113,400 | $170,600 |
| 2024 | $4,225 | $285,300 | $113,400 | $171,900 |
| 2023 | $3,947 | $254,000 | $113,400 | $140,600 |
| 2022 | $3,609 | $229,000 | $102,800 | $126,200 |
| 2021 | $3,500 | $207,100 | $96,800 | $110,300 |
| 2020 | $3,406 | $200,500 | $96,800 | $103,700 |
| 2019 | $3,400 | $200,500 | $96,800 | $103,700 |
| 2018 | $3,419 | $200,500 | $96,800 | $103,700 |
| 2017 | $3,419 | $200,500 | $96,800 | $103,700 |
| 2016 | $3,417 | $201,100 | $93,200 | $107,900 |
| 2015 | $3,350 | $197,200 | $91,300 | $105,900 |
| 2014 | $813 | $197,200 | $91,300 | $105,900 |
Source: Public Records
Map
Nearby Homes
- 70 Verdugo St
- 163 Woodmont St
- 151 Woodmont St
- 145 Woodmont St
- 169 Woodmont St
- 78 Verdugo St
- 49 Verdugo St
- 59 Verdugo St
- 179 Woodmont St
- 123 Woodmont St
- 73 Verdugo St
- 83 Verdugo St
- 119 Woodmont St
- 158 Woodmont St
- 148 Woodmont St
- 88 Verdugo St
- 170 Woodmont St
- 191 Woodmont St
- 144 Woodmont St
- 113 Woodmont St