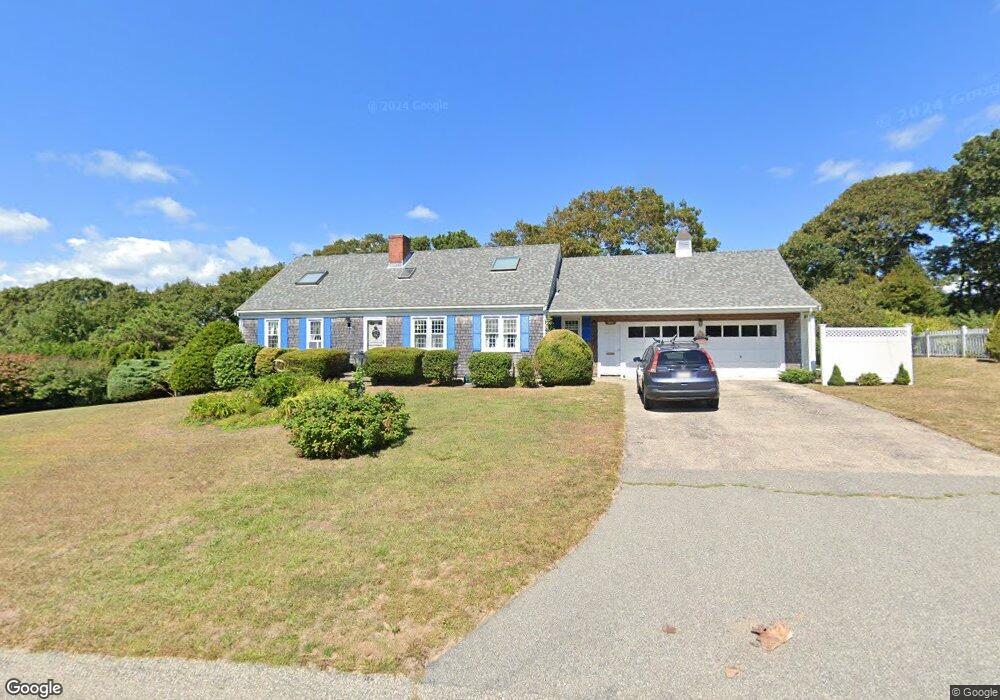
56 View Crest Dr Falmouth, MA 02540
Estimated Value: $1,150,256 - $1,294,000
3
Beds
2
Baths
2,122
Sq Ft
$580/Sq Ft
Est. Value
About This Home
This home is located at 56 View Crest Dr, Falmouth, MA 02540 and is currently estimated at $1,230,564, approximately $579 per square foot. 56 View Crest Dr is a home located in Barnstable County with nearby schools including Mullen-Hall School, Morse Pond School, and Lawrence School.
Ownership History
Date
Name
Owned For
Owner Type
Purchase Details
Closed on
Jun 28, 2006
Sold by
Shafer Merrill W
Bought by
Merrill W Shafer Lt
Current Estimated Value
Purchase Details
Closed on
Mar 20, 1995
Sold by
Freitas Livio A and Francis Angela S
Bought by
Marquardt Merlin D and Marquardt Virginia H
Home Financials for this Owner
Home Financials are based on the most recent Mortgage that was taken out on this home.
Original Mortgage
$398,000
Interest Rate
8.89%
Mortgage Type
Purchase Money Mortgage
Purchase Details
Closed on
Jan 4, 1995
Sold by
Shafer Merrill
Bought by
Freitas Livio A
Create a Home Valuation Report for This Property
The Home Valuation Report is an in-depth analysis detailing your home's value as well as a comparison with similar homes in the area
Home Values in the Area
Average Home Value in this Area
Purchase History
| Date | Buyer | Sale Price | Title Company |
|---|---|---|---|
| Merrill W Shafer Lt | -- | -- | |
| Marquardt Merlin D | $148,000 | -- | |
| Freitas Livio A | $103,000 | -- |
Source: Public Records
Mortgage History
| Date | Status | Borrower | Loan Amount |
|---|---|---|---|
| Previous Owner | Marquardt Merlin D | $398,000 |
Source: Public Records
Tax History Compared to Growth
Tax History
| Year | Tax Paid | Tax Assessment Tax Assessment Total Assessment is a certain percentage of the fair market value that is determined by local assessors to be the total taxable value of land and additions on the property. | Land | Improvement |
|---|---|---|---|---|
| 2025 | $6,648 | $1,132,500 | $544,600 | $587,900 |
| 2024 | $6,659 | $1,060,400 | $520,600 | $539,800 |
| 2023 | $5,373 | $776,400 | $389,300 | $387,100 |
| 2022 | $5,720 | $710,500 | $388,700 | $321,800 |
| 2021 | $5,549 | $652,800 | $371,800 | $281,000 |
| 2020 | $5,317 | $619,000 | $338,000 | $281,000 |
| 2019 | $5,236 | $611,700 | $338,000 | $273,700 |
| 2018 | $5,212 | $606,000 | $338,000 | $268,000 |
| 2017 | $5,072 | $594,600 | $338,000 | $256,600 |
| 2016 | $4,977 | $594,600 | $338,000 | $256,600 |
| 2015 | $4,870 | $594,600 | $338,000 | $256,600 |
| 2014 | $4,786 | $587,200 | $338,100 | $249,100 |
Source: Public Records
Map
Nearby Homes