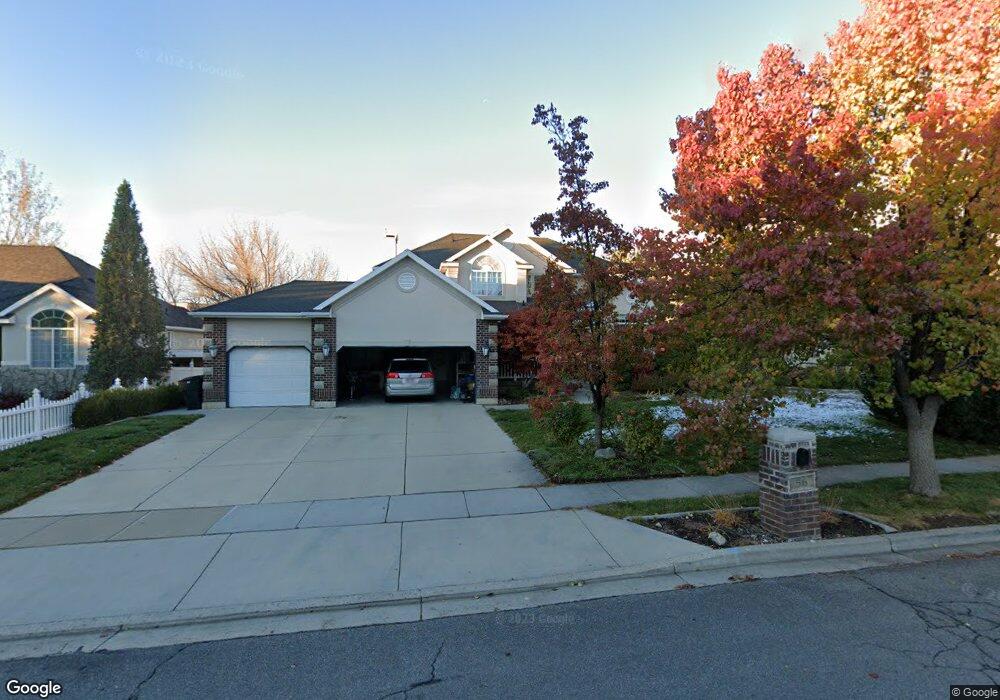
56 W 1350 N Bountiful, UT 84010
Estimated Value: $622,000 - $814,423
6
Beds
4
Baths
4,106
Sq Ft
$183/Sq Ft
Est. Value
About This Home
This home is located at 56 W 1350 N, Bountiful, UT 84010 and is currently estimated at $751,606, approximately $183 per square foot. 56 W 1350 N is a home located in Davis County with nearby schools including Meadowbrook Elementary School, Bountiful Junior High School, and Viewmont High School.
Ownership History
Date
Name
Owned For
Owner Type
Purchase Details
Closed on
Nov 14, 2014
Sold by
Gordon Matthew S and Gordon Lara S
Bought by
Gordon Matthew S and Gordon Sara S
Current Estimated Value
Home Financials for this Owner
Home Financials are based on the most recent Mortgage that was taken out on this home.
Original Mortgage
$344,000
Outstanding Balance
$263,726
Interest Rate
4.1%
Mortgage Type
New Conventional
Estimated Equity
$487,880
Purchase Details
Closed on
Jul 30, 2009
Sold by
Burningham Jason W and Burningham Holly L
Bought by
Gordon Matthew S and Gordon Lara S
Home Financials for this Owner
Home Financials are based on the most recent Mortgage that was taken out on this home.
Original Mortgage
$391,281
Interest Rate
5.31%
Mortgage Type
FHA
Purchase Details
Closed on
Jul 31, 1998
Sold by
Ivory Homes
Bought by
Burningham Jason W and Burningham Holly L
Home Financials for this Owner
Home Financials are based on the most recent Mortgage that was taken out on this home.
Original Mortgage
$215,000
Interest Rate
6.9%
Create a Home Valuation Report for This Property
The Home Valuation Report is an in-depth analysis detailing your home's value as well as a comparison with similar homes in the area
Purchase History
| Date | Buyer | Sale Price | Title Company |
|---|---|---|---|
| Gordon Matthew S | -- | Us Title Company Of | |
| Gordon Matthew S | -- | First American Title | |
| Burningham Jason W | -- | Guardian Title Company |
Source: Public Records
Mortgage History
| Date | Status | Borrower | Loan Amount |
|---|---|---|---|
| Open | Gordon Matthew S | $344,000 | |
| Closed | Gordon Matthew S | $391,281 | |
| Previous Owner | Burningham Jason W | $215,000 |
Source: Public Records
Tax History
| Year | Tax Paid | Tax Assessment Tax Assessment Total Assessment is a certain percentage of the fair market value that is determined by local assessors to be the total taxable value of land and additions on the property. | Land | Improvement |
|---|---|---|---|---|
| 2025 | $4,477 | $414,150 | $143,631 | $270,519 |
| 2024 | $4,134 | $393,800 | $131,892 | $261,908 |
| 2023 | $4,004 | $692,000 | $239,352 | $452,648 |
| 2022 | $4,168 | $395,450 | $129,820 | $265,630 |
| 2021 | $3,752 | $545,000 | $170,039 | $374,961 |
| 2020 | $3,234 | $471,000 | $143,297 | $327,703 |
| 2019 | $3,228 | $459,000 | $143,200 | $315,800 |
| 2018 | $3,021 | $423,000 | $138,797 | $284,203 |
| 2016 | $2,792 | $212,575 | $60,546 | $152,029 |
| 2015 | $3,116 | $225,665 | $60,546 | $165,119 |
| 2014 | -- | $241,013 | $60,546 | $180,467 |
| 2013 | -- | $197,609 | $49,921 | $147,688 |
Source: Public Records
Map
Nearby Homes
Your Personal Tour Guide
Ask me questions while you tour the home.