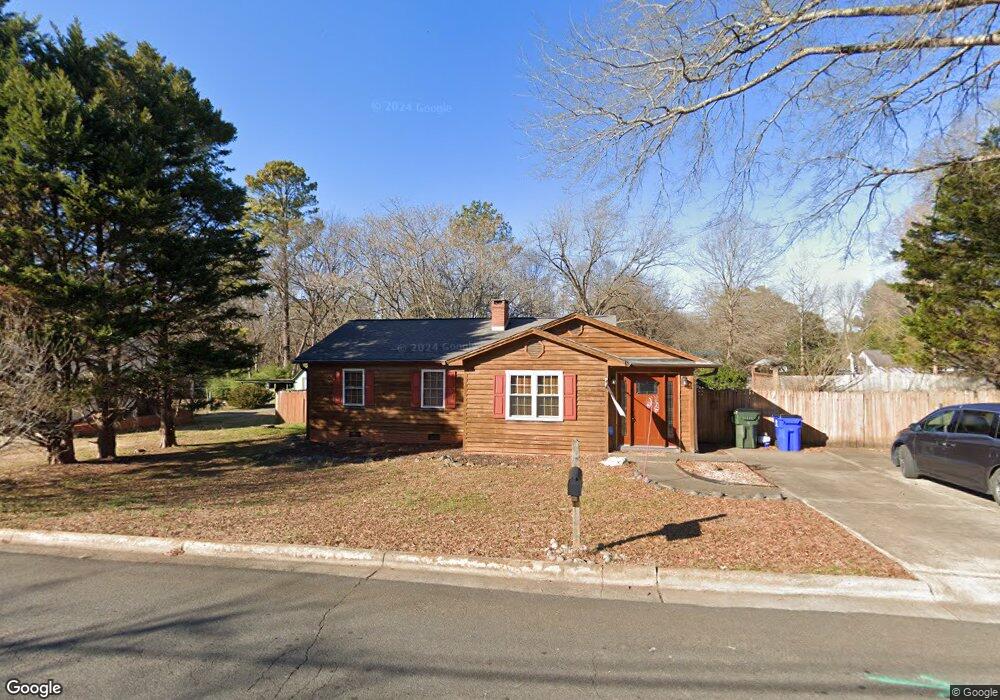
56 W Cornwallis St Pittsboro, NC 27312
Estimated Value: $318,000 - $347,000
3
Beds
2
Baths
1,374
Sq Ft
$238/Sq Ft
Est. Value
About This Home
This home is located at 56 W Cornwallis St, Pittsboro, NC 27312 and is currently estimated at $327,484, approximately $238 per square foot. 56 W Cornwallis St is a home located in Chatham County with nearby schools including Pittsboro Elementary School, George Moses Horton Middle School, and Northwood High.
Ownership History
Date
Name
Owned For
Owner Type
Purchase Details
Closed on
Oct 10, 2017
Sold by
Bledsoe Nancy Gray
Bought by
Budda Gail
Current Estimated Value
Home Financials for this Owner
Home Financials are based on the most recent Mortgage that was taken out on this home.
Original Mortgage
$177,510
Outstanding Balance
$148,390
Interest Rate
3.85%
Mortgage Type
New Conventional
Estimated Equity
$179,094
Purchase Details
Closed on
Mar 18, 2005
Sold by
Martin Paul M
Bought by
Randolph Katherine E
Home Financials for this Owner
Home Financials are based on the most recent Mortgage that was taken out on this home.
Original Mortgage
$109,600
Interest Rate
5.57%
Mortgage Type
New Conventional
Create a Home Valuation Report for This Property
The Home Valuation Report is an in-depth analysis detailing your home's value as well as a comparison with similar homes in the area
Home Values in the Area
Average Home Value in this Area
Purchase History
| Date | Buyer | Sale Price | Title Company |
|---|---|---|---|
| Budda Gail | $183,000 | None Available | |
| Randolph Katherine E | $13,700,000 | None Available |
Source: Public Records
Mortgage History
| Date | Status | Borrower | Loan Amount |
|---|---|---|---|
| Open | Budda Gail | $177,510 | |
| Previous Owner | Randolph Katherine E | $109,600 |
Source: Public Records
Tax History Compared to Growth
Tax History
| Year | Tax Paid | Tax Assessment Tax Assessment Total Assessment is a certain percentage of the fair market value that is determined by local assessors to be the total taxable value of land and additions on the property. | Land | Improvement |
|---|---|---|---|---|
| 2025 | $3,020 | $266,844 | $54,920 | $211,924 |
| 2024 | $3,020 | $186,934 | $51,487 | $135,447 |
| 2023 | $2,413 | $186,934 | $51,487 | $135,447 |
| 2022 | $2,276 | $186,934 | $51,487 | $135,447 |
| 2021 | $2,253 | $186,934 | $51,487 | $135,447 |
| 2020 | $1,854 | $150,407 | $47,250 | $103,157 |
| 2019 | $1,844 | $150,407 | $47,250 | $103,157 |
| 2018 | $1,761 | $150,407 | $47,250 | $103,157 |
| 2017 | $965 | $150,407 | $47,250 | $103,157 |
| 2016 | $836 | $125,349 | $35,000 | $90,349 |
| 2015 | $826 | $125,349 | $35,000 | $90,349 |
| 2014 | $829 | $125,349 | $35,000 | $90,349 |
| 2013 | -- | $125,349 | $35,000 | $90,349 |
Source: Public Records
Map
Nearby Homes
- 15 Juniper Ct
- 0 Nc 87 Hwy Unit 2491586
- 344 May Farm Rd
- 162 Gaines Trail
- 74 Brookridge Ct
- 66 Toomer Loop Rd
- 0 N Carolina 902
- 00 N Carolina 902
- 000 Alston Chapel Rd
- 298 E Salisbury St
- 507 W Salisbury St
- Tbd Versailles Ln
- 726 Thompson St
- 425 Credle St
- 248 Ashford Dr
- 24 Cynthia Ln
- 25 Juleann Ln
- 41 Cottage Way
- 501 U S 15
- 230 Oakwood Dr
- 70 W Cornwallis St
- 74 W Cornwallis St
- TBD W Cornwallis St
- 624 Sanford Rd
- 71 W Cornwallis St
- 92 W Cornwallis St
- 656 Sanford Rd
- 598 Sanford Rd
- 97 W Cornwallis St
- 108 W Cornwallis St
- 580 Sanford Rd
- 115 W Cornwallis St
- 686 Sanford Rd
- 126 W Cornwallis St
- 611 Sanford Rd
- 631 Sanford Rd
- 0 E Cornwallis Rd Unit none 1650367
- 192 W Cornwallis St
- 131 W Cornwallis St
- 698 Sanford Rd