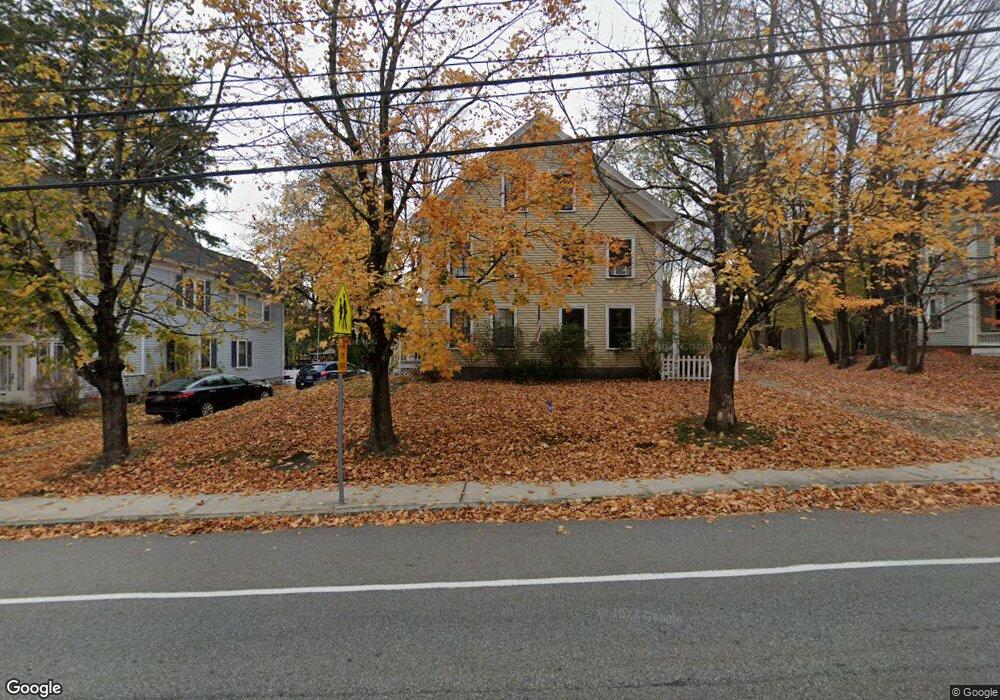
56 W Main St Unit 1 Merrimac, MA 01860
Estimated Value: $422,000 - $512,000
3
Beds
2
Baths
2,050
Sq Ft
$225/Sq Ft
Est. Value
About This Home
This home is located at 56 W Main St Unit 1, Merrimac, MA 01860 and is currently estimated at $460,698, approximately $224 per square foot. 56 W Main St Unit 1 is a home located in Essex County with nearby schools including Pentucket Regional High School.
Ownership History
Date
Name
Owned For
Owner Type
Purchase Details
Closed on
Aug 24, 2012
Sold by
Smith Peter F and Smith Janet E
Bought by
Harris J K and Harris Christina M
Current Estimated Value
Home Financials for this Owner
Home Financials are based on the most recent Mortgage that was taken out on this home.
Original Mortgage
$216,600
Outstanding Balance
$149,626
Interest Rate
3.61%
Mortgage Type
New Conventional
Estimated Equity
$311,072
Purchase Details
Closed on
Oct 15, 2004
Sold by
Donovan Brian and Donovan Jodi S
Bought by
Smith Peter F and Smith Janet E
Purchase Details
Closed on
Apr 3, 1995
Sold by
Ouellette Louise E
Bought by
Bowler Deborah and Bowler Philip
Create a Home Valuation Report for This Property
The Home Valuation Report is an in-depth analysis detailing your home's value as well as a comparison with similar homes in the area
Home Values in the Area
Average Home Value in this Area
Purchase History
| Date | Buyer | Sale Price | Title Company |
|---|---|---|---|
| Harris J K | $228,000 | -- | |
| Smith Peter F | $279,900 | -- | |
| Bowler Deborah | $160,000 | -- |
Source: Public Records
Mortgage History
| Date | Status | Borrower | Loan Amount |
|---|---|---|---|
| Open | Bowler Deborah | $216,600 | |
| Previous Owner | Bowler Deborah | $213,000 |
Source: Public Records
Tax History Compared to Growth
Tax History
| Year | Tax Paid | Tax Assessment Tax Assessment Total Assessment is a certain percentage of the fair market value that is determined by local assessors to be the total taxable value of land and additions on the property. | Land | Improvement |
|---|---|---|---|---|
| 2025 | $4,765 | $359,600 | $0 | $359,600 |
| 2024 | $4,660 | $345,200 | $0 | $345,200 |
| 2023 | $4,455 | $301,600 | $0 | $301,600 |
| 2022 | $4,485 | $274,500 | $0 | $274,500 |
| 2021 | $4,474 | $274,500 | $0 | $274,500 |
| 2020 | $3,866 | $259,800 | $0 | $259,800 |
| 2019 | $3,540 | $223,900 | $0 | $223,900 |
| 2018 | $3,529 | $223,900 | $0 | $223,900 |
| 2017 | $3,659 | $223,900 | $0 | $223,900 |
| 2016 | $3,129 | $193,600 | $0 | $193,600 |
| 2015 | $3,284 | $202,100 | $0 | $202,100 |
| 2014 | $3,211 | $202,100 | $0 | $202,100 |
Source: Public Records
Map
Nearby Homes