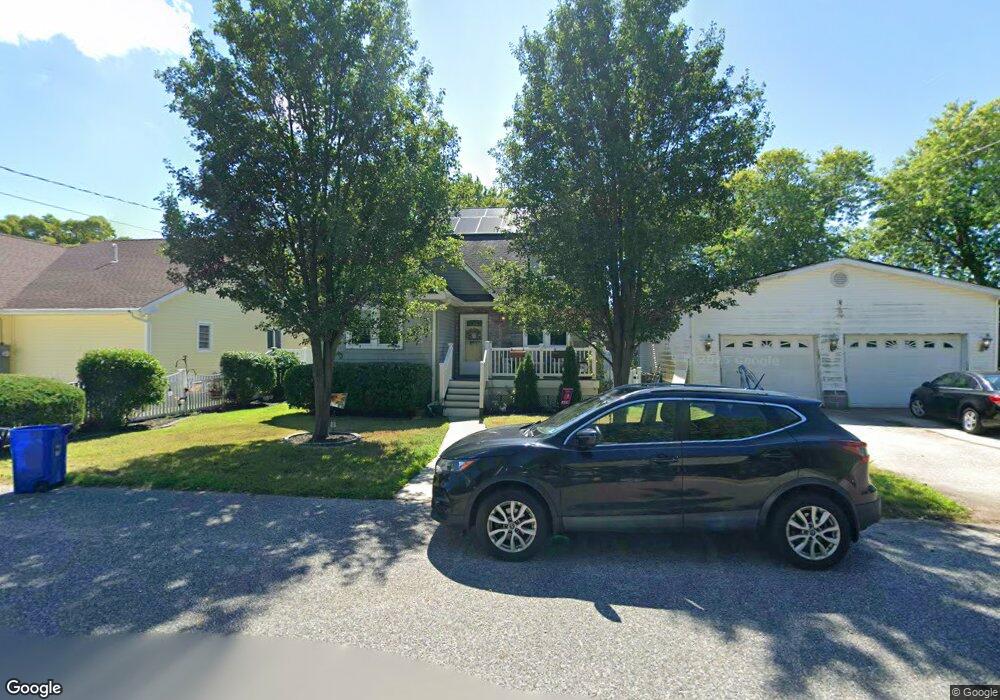
56 Walnut Ave Villas, NJ 08251
Estimated Value: $539,383 - $633,000
Studio
--
Bath
1,612
Sq Ft
$366/Sq Ft
Est. Value
About This Home
This home is located at 56 Walnut Ave, Villas, NJ 08251 and is currently estimated at $590,096, approximately $366 per square foot. 56 Walnut Ave is a home located in Cape May County with nearby schools including David C. Douglass Veterans Memorial School, Carl T. Mitnick School, and Maud Abrams School.
Ownership History
Date
Name
Owned For
Owner Type
Purchase Details
Closed on
Sep 30, 2021
Sold by
Fiorabanti Louis C
Bought by
Mccarty William and Mccarty Marianne G
Current Estimated Value
Home Financials for this Owner
Home Financials are based on the most recent Mortgage that was taken out on this home.
Original Mortgage
$419,430
Outstanding Balance
$382,481
Interest Rate
2.8%
Mortgage Type
Purchase Money Mortgage
Estimated Equity
$207,615
Purchase Details
Closed on
Apr 3, 2013
Sold by
Steiger Eric
Bought by
Fioravanti Louis C
Home Financials for this Owner
Home Financials are based on the most recent Mortgage that was taken out on this home.
Original Mortgage
$200,000
Interest Rate
3.58%
Mortgage Type
New Conventional
Purchase Details
Closed on
Feb 29, 2008
Sold by
Xavier Dorothy E
Bought by
Steiger Eric
Purchase Details
Closed on
Oct 15, 1990
Sold by
Creely Charles J
Bought by
Xavier Ernest L and Xavier Dorothy E
Create a Home Valuation Report for This Property
The Home Valuation Report is an in-depth analysis detailing your home's value as well as a comparison with similar homes in the area
Home Values in the Area
Average Home Value in this Area
Purchase History
| Date | Buyer | Sale Price | Title Company |
|---|---|---|---|
| Mccarty William | $410,000 | None Available | |
| Fioravanti Louis C | $250,000 | Shore Title Agency Inc | |
| Steiger Eric | $100,000 | None Available | |
| Xavier Ernest L | $54,000 | -- |
Source: Public Records
Mortgage History
| Date | Status | Borrower | Loan Amount |
|---|---|---|---|
| Open | Mccarty William | $419,430 | |
| Previous Owner | Fioravanti Louis C | $200,000 |
Source: Public Records
Tax History
| Year | Tax Paid | Tax Assessment Tax Assessment Total Assessment is a certain percentage of the fair market value that is determined by local assessors to be the total taxable value of land and additions on the property. | Land | Improvement |
|---|---|---|---|---|
| 2025 | $4,499 | $222,300 | $78,000 | $144,300 |
| 2024 | $4,499 | $222,300 | $78,000 | $144,300 |
Source: Public Records
Map
Nearby Homes
Your Personal Tour Guide
Ask me questions while you tour the home.