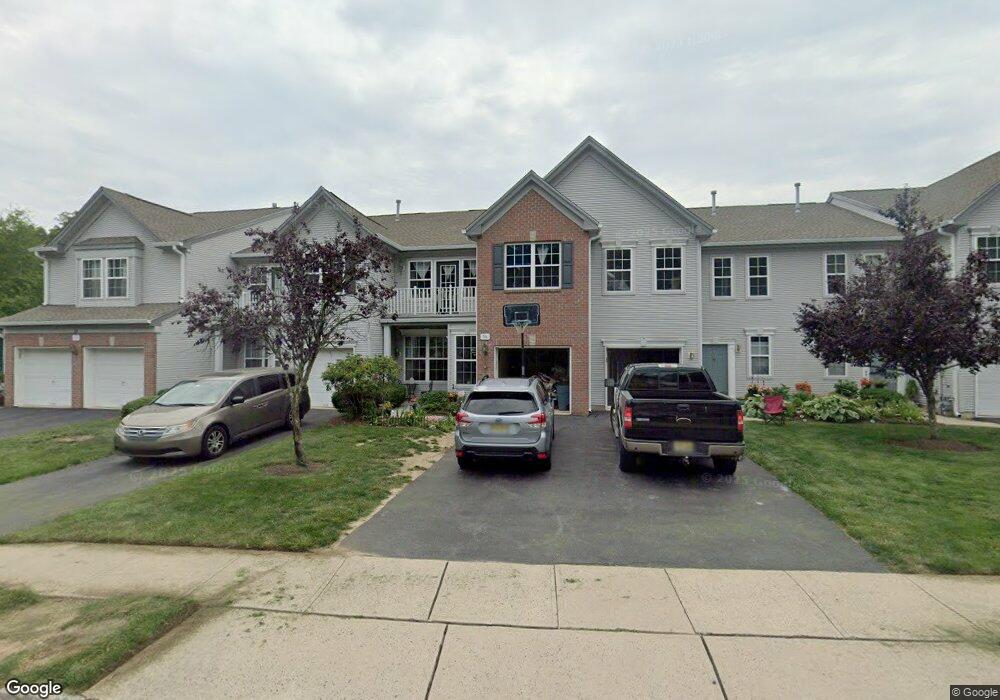
56 Warwick Rd Unit C1 Princeton Junction, NJ 08550
Estimated Value: $762,028 - $827,000
3
Beds
3
Baths
1,968
Sq Ft
$402/Sq Ft
Est. Value
About This Home
This home is located at 56 Warwick Rd Unit C1, Princeton Junction, NJ 08550 and is currently estimated at $792,007, approximately $402 per square foot. 56 Warwick Rd Unit C1 is a home located in Mercer County with nearby schools including Village Elementary School, Dutch Neck Elementary School, and Community Middle School.
Ownership History
Date
Name
Owned For
Owner Type
Purchase Details
Closed on
Jan 7, 2011
Sold by
Periasamy Malarvel and Vijayathevar Rajeswari
Bought by
Roy Arabinda and Rout Somani
Current Estimated Value
Home Financials for this Owner
Home Financials are based on the most recent Mortgage that was taken out on this home.
Original Mortgage
$322,500
Outstanding Balance
$218,182
Interest Rate
4.62%
Mortgage Type
New Conventional
Estimated Equity
$573,825
Purchase Details
Closed on
Jul 11, 2003
Sold by
K Hovnanian At West Windsor Ll
Bought by
Periasamy Malarvel and Ponnuram Rajeswari
Home Financials for this Owner
Home Financials are based on the most recent Mortgage that was taken out on this home.
Original Mortgage
$260,000
Interest Rate
6.25%
Mortgage Type
Purchase Money Mortgage
Create a Home Valuation Report for This Property
The Home Valuation Report is an in-depth analysis detailing your home's value as well as a comparison with similar homes in the area
Home Values in the Area
Average Home Value in this Area
Purchase History
| Date | Buyer | Sale Price | Title Company |
|---|---|---|---|
| Roy Arabinda | $430,000 | Weichert Title Agency | |
| Periasamy Malarvel | $331,465 | -- |
Source: Public Records
Mortgage History
| Date | Status | Borrower | Loan Amount |
|---|---|---|---|
| Open | Roy Arabinda | $322,500 | |
| Previous Owner | Periasamy Malarvel | $260,000 |
Source: Public Records
Tax History Compared to Growth
Tax History
| Year | Tax Paid | Tax Assessment Tax Assessment Total Assessment is a certain percentage of the fair market value that is determined by local assessors to be the total taxable value of land and additions on the property. | Land | Improvement |
|---|---|---|---|---|
| 2025 | $13,051 | $425,800 | $125,000 | $300,800 |
| 2024 | $12,506 | $425,800 | $125,000 | $300,800 |
| 2023 | $12,506 | $425,800 | $125,000 | $300,800 |
| 2022 | $12,263 | $425,800 | $125,000 | $300,800 |
| 2021 | $11,770 | $412,100 | $125,000 | $287,100 |
| 2020 | $11,555 | $412,100 | $125,000 | $287,100 |
| 2019 | $11,423 | $412,100 | $125,000 | $287,100 |
| 2018 | $11,316 | $412,100 | $125,000 | $287,100 |
| 2017 | $11,081 | $412,100 | $125,000 | $287,100 |
| 2016 | $10,842 | $412,100 | $125,000 | $287,100 |
| 2015 | $10,591 | $412,100 | $125,000 | $287,100 |
| 2014 | $10,467 | $412,100 | $125,000 | $287,100 |
Source: Public Records
Map
Nearby Homes
- 17 Springhill Dr
- 53 N Post Rd
- 4 Banff Dr
- 834 Village Rd W
- 44 Sapphire Dr
- 40 Caleb Ln
- 30 Voscek Ct
- 23 Voscek Ct
- 9 Wedgewood Ct
- 4024 Quakerbridge Rd
- 18103 Donatello Dr
- 18201 Donatello Dr
- 27 Drewes Ct
- 59 Oneill Ct
- 83 Drewes Ct
- 11 Poillon Ct
- 298 N Post Rd
- 11106 Donatello Dr
- 10206 Donatello Dr
- 8203 Donatello Dr