56 Willow Walk Dr Unit C0403 Ledgewood, NJ 07852
Estimated Value: $581,223 - $611,000
--
Bed
--
Bath
2,211
Sq Ft
$269/Sq Ft
Est. Value
About This Home
This home is located at 56 Willow Walk Dr Unit C0403, Ledgewood, NJ 07852 and is currently estimated at $594,806, approximately $269 per square foot. 56 Willow Walk Dr Unit C0403 is a home located in Morris County with nearby schools including Eisenhower Middle School, Lincoln Roosevelt Elementary School, and Roxbury High School.
Ownership History
Date
Name
Owned For
Owner Type
Purchase Details
Closed on
May 20, 2022
Sold by
Kemp Frank H and Kemp Lorraine
Bought by
Desjardins Cherry
Current Estimated Value
Home Financials for this Owner
Home Financials are based on the most recent Mortgage that was taken out on this home.
Original Mortgage
$299,888
Outstanding Balance
$284,887
Interest Rate
5.25%
Mortgage Type
New Conventional
Estimated Equity
$309,919
Purchase Details
Closed on
Jun 28, 2007
Sold by
Wetzel Bruce R and Wetzel Joan E
Bought by
Kemp Frank and Kemp Lorraine
Purchase Details
Closed on
May 11, 2006
Sold by
Wetzel Bruce
Bought by
Wetzel Bruce and Wetzel Joan
Purchase Details
Closed on
Oct 31, 1997
Sold by
Willow Walk Development Company Inc
Bought by
Wetzel Bruce R and Wetzel Joan E
Home Financials for this Owner
Home Financials are based on the most recent Mortgage that was taken out on this home.
Original Mortgage
$135,000
Interest Rate
7.25%
Create a Home Valuation Report for This Property
The Home Valuation Report is an in-depth analysis detailing your home's value as well as a comparison with similar homes in the area
Home Values in the Area
Average Home Value in this Area
Purchase History
| Date | Buyer | Sale Price | Title Company |
|---|---|---|---|
| Desjardins Cherry | $474,888 | None Listed On Document | |
| Kemp Frank | $410,000 | Foundation Title Llc | |
| Wetzel Bruce | -- | -- | |
| Wetzel Bruce R | $184,990 | -- |
Source: Public Records
Mortgage History
| Date | Status | Borrower | Loan Amount |
|---|---|---|---|
| Open | Desjardins Cherry | $299,888 | |
| Previous Owner | Wetzel Bruce R | $135,000 |
Source: Public Records
Tax History Compared to Growth
Tax History
| Year | Tax Paid | Tax Assessment Tax Assessment Total Assessment is a certain percentage of the fair market value that is determined by local assessors to be the total taxable value of land and additions on the property. | Land | Improvement |
|---|---|---|---|---|
| 2025 | $9,819 | $357,200 | $115,000 | $242,200 |
| 2024 | $9,666 | $357,200 | $115,000 | $242,200 |
| 2023 | $9,666 | $357,200 | $115,000 | $242,200 |
| 2022 | $8,451 | $357,200 | $115,000 | $242,200 |
| 2021 | $8,451 | $357,200 | $115,000 | $242,200 |
| 2020 | $9,391 | $357,200 | $115,000 | $242,200 |
| 2019 | $9,216 | $357,200 | $115,000 | $242,200 |
| 2018 | $8,788 | $203,900 | $53,800 | $150,100 |
| 2017 | $8,741 | $203,900 | $53,800 | $150,100 |
| 2016 | $8,570 | $203,900 | $53,800 | $150,100 |
| 2015 | $8,108 | $203,900 | $53,800 | $150,100 |
| 2014 | $7,975 | $203,900 | $53,800 | $150,100 |
Source: Public Records
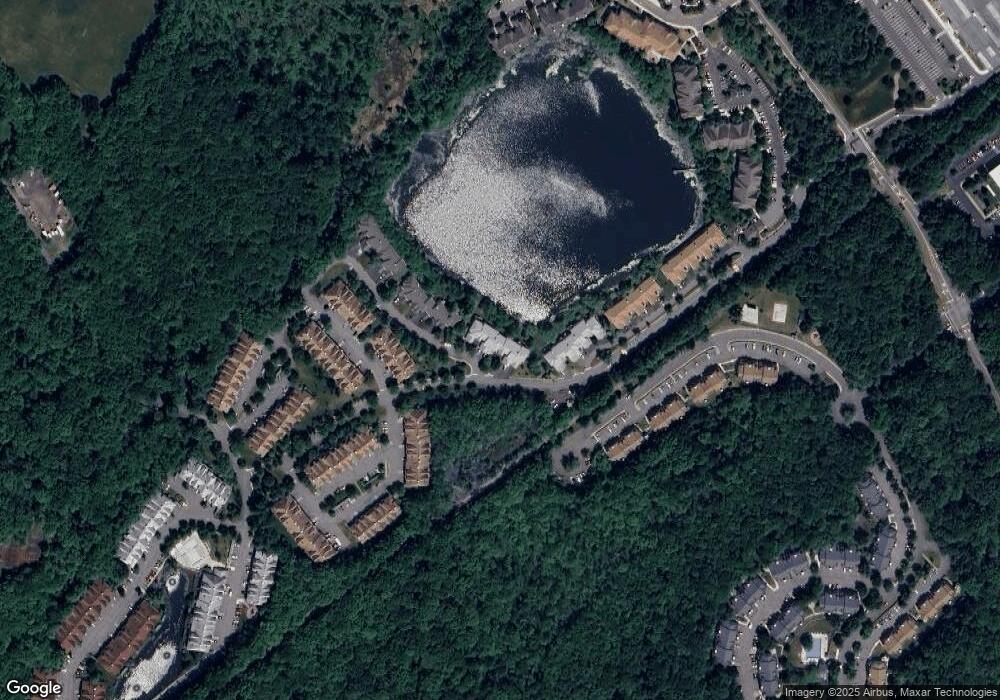
Map
Nearby Homes
- 30 Woods Edge Dr
- 26 Woods Edge Dr
- 85 Autumn Ct
- 94 Woods Edge Dr
- 117 Woods Edge Dr
- 219 Woods Edge Dr Unit 219
- 7 Mountainview Rd
- 31 Emmans Rd
- 31 Drake Ln
- 33 Canal St
- 238 Drake Ln Unit 238
- 11 Unneberg Ave
- 34 Hunter St
- 16 Mount Arlington Rd
- 17 Unneberg Ave
- 54 Mapledale Ave
- 3 Beechwood Dr
- 142 S Hillside Ave
- 23 Horizon Dr
- 33 N Hillside Ave
- 54 Willow Walk Dr
- 2 Loch Ln Unit C404
- 52 Willow Walk Dr Unit C0401
- 4 Loch Ln
- 6 Loch Ln
- 8 Loch Ln Unit C0407
- 50 Willow Walk Dr
- 42 Lagoon Way
- 40 Lagoon Way
- 10 Loch Ln
- 38 Lagoon Way
- 36 Lagoon Way
- 14 Loch Ln Unit C0503
- 34 Lagoon Way
- 29 Loch Ln Unit C0803
- 33 Autumn Ct
- 31 Loch Ln Unit C0804
- 35 Autumn Ct
- 16 Loch Ln Unit 504
- 33 Loch Ln Unit C0805