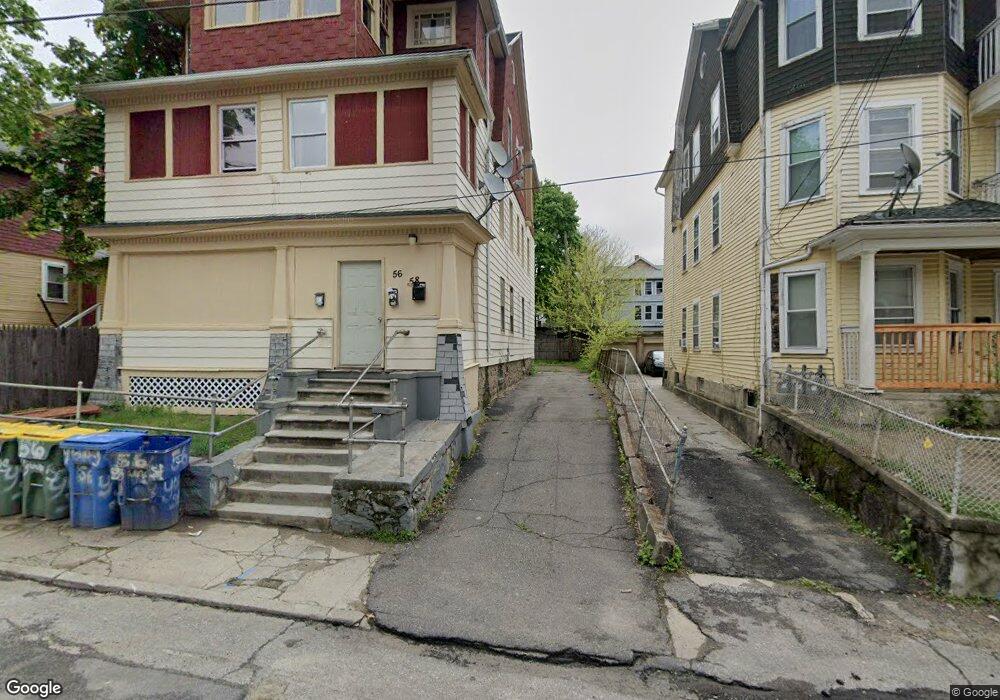
56 Young St Waterbury, CT 06704
North End District NeighborhoodEstimated Value: $309,000 - $432,000
3
Beds
1
Bath
3,174
Sq Ft
$119/Sq Ft
Est. Value
About This Home
This home is located at 56 Young St, Waterbury, CT 06704 and is currently estimated at $376,333, approximately $118 per square foot. 56 Young St is a home located in New Haven County with nearby schools including Woodrow Wilson School, Michael F. Wallace Middle School, and Crosby High School.
Ownership History
Date
Name
Owned For
Owner Type
Purchase Details
Closed on
Apr 8, 2024
Sold by
Rhoden Leroy F M
Bought by
Best Choice Llc
Current Estimated Value
Purchase Details
Closed on
Sep 21, 2009
Sold by
Fisch Martin
Bought by
56-58 Young Street Llc
Purchase Details
Closed on
May 4, 2009
Sold by
West Geraldine and Bank Of New York
Bought by
Bank Of New York
Create a Home Valuation Report for This Property
The Home Valuation Report is an in-depth analysis detailing your home's value as well as a comparison with similar homes in the area
Home Values in the Area
Average Home Value in this Area
Purchase History
| Date | Buyer | Sale Price | Title Company |
|---|---|---|---|
| Best Choice Llc | -- | None Available | |
| Best Choice Llc | -- | None Available | |
| 56-58 Young Street Llc | -- | -- | |
| Fisch Martin | $34,000 | -- | |
| Fisch Martin | $34,000 | -- | |
| Bank Of New York | -- | -- | |
| Bank Of New York | -- | -- |
Source: Public Records
Tax History Compared to Growth
Tax History
| Year | Tax Paid | Tax Assessment Tax Assessment Total Assessment is a certain percentage of the fair market value that is determined by local assessors to be the total taxable value of land and additions on the property. | Land | Improvement |
|---|---|---|---|---|
| 2025 | $4,628 | $102,900 | $11,060 | $91,840 |
| 2024 | $5,087 | $102,900 | $11,060 | $91,840 |
| 2023 | $5,576 | $102,900 | $11,060 | $91,840 |
| 2022 | $2,450 | $40,690 | $11,090 | $29,600 |
| 2021 | $2,450 | $40,690 | $11,090 | $29,600 |
| 2020 | $2,450 | $40,690 | $11,090 | $29,600 |
| 2019 | $2,450 | $40,690 | $11,090 | $29,600 |
| 2018 | $2,450 | $40,690 | $11,090 | $29,600 |
| 2017 | $2,434 | $40,420 | $11,080 | $29,340 |
| 2016 | $2,434 | $40,420 | $11,080 | $29,340 |
| 2015 | $2,353 | $40,420 | $11,080 | $29,340 |
| 2014 | $2,353 | $40,420 | $11,080 | $29,340 |
Source: Public Records
Map
Nearby Homes